
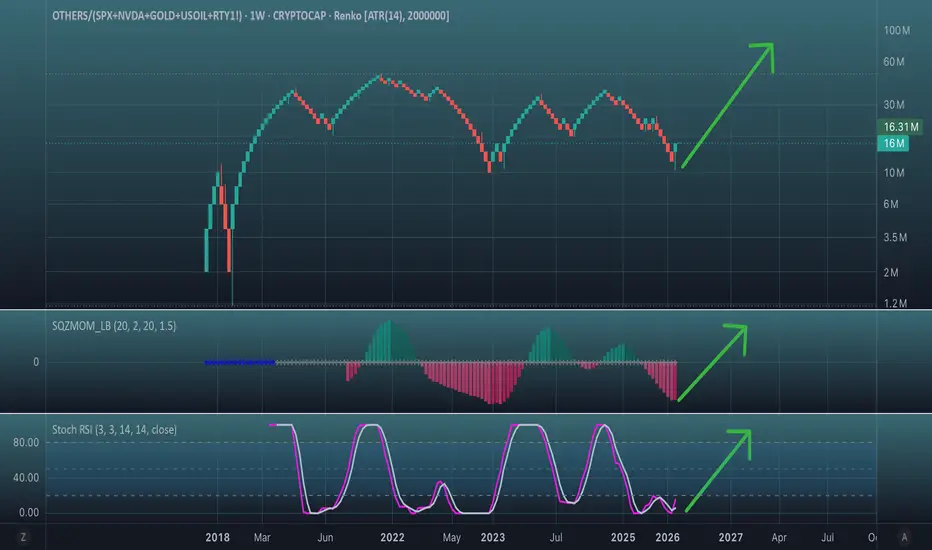
I've noticed that many traders have already clearly recognized how the altcoin market is gaining strength against one asset after another.
I haven't published composite charts in a while. Let's add a little exoticism!
Let's pair alts against a composite of:
`CRYPTOCAP:OTHERS / (SP:SPX + NASDAQ:NVDA + TVC:GOLD + TVC:USOIL + CME_MINI:RTY1!)`
The idea is that these are all pillars of the traditional, conventional markets.
And what do we see? Altcoins are gaining strength AGAINST ALL of these market pillars.
A bottom has formed (the brick with the wick), and further movement is now developing.
The oscillators on the Renko chart indicate that we are at the very beginning of the process.
Just the first bearish column has contracted, and the Stochastic RSI has printed a
cross in the basement.
The picture suggests that this rally will not resemble previous 2–3-month cycles.
It will take considerably longer to reach its highs.
Perhaps the scenario in which this process takes two years to reach the point where it intersects the 3.618 orbit is precisely what tells us where this is heading.
Note
The Yen is rising as expected, which is a standard sign of a risk-off environment.
At the same time, non-traditional risky assets are readily absorbing the displaced liquidity.

Disclaimer
The information and publications are not meant to be, and do not constitute, financial, investment, trading, or other types of advice or recommendations supplied or endorsed by TradingView. Read more in the Terms of Use.
Disclaimer
The information and publications are not meant to be, and do not constitute, financial, investment, trading, or other types of advice or recommendations supplied or endorsed by TradingView. Read more in the Terms of Use.