
PC Jeweller is catching the attention of many market participants right now. The company is moving away from its past financial stress and entering a new growth phase. Both the business fundamentals and the weekly technical chart show interesting developments.
The Turnaround Factors
The company has successfully cleared more than 90% of its old bank debt under its settlement agreement. Management officially expects the firm to become completely debt-free within the ongoing quarter by September. Alongside this, the operational recovery looks stable, with a 21% year-on-year growth in consolidated revenue for the recent April to June quarter. To scale up further without heavy costs, the company is in advanced talks to open up to 100 large-format franchise showrooms over the next 12 to 18 months.
Record Volume and Market Interest
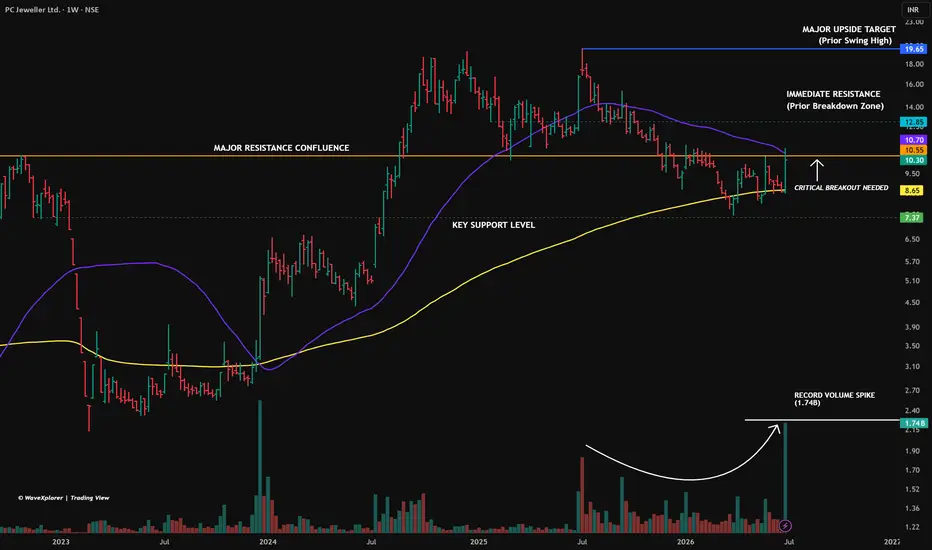
The weekly chart shows a prominent rise in buying interest. A massive volume spike of 1.74 billion shares occurred during the recent positive move. This indicates a high level of fresh market participation, which usually hints at accumulators taking positions after a long consolidation period.
Key Levels and the Breakout Plan
The price is currently trading near 10.30, right below a major resistance confluence zone between 10.55 and 10.70. This zone includes a structural horizontal level and the declining purple moving average line. A clean weekly closing above 10.70 is needed to confirm a proper breakout.
Once the breakout happens and holds, the next step up points toward the intermediate resistance at 12.85, which acted as a major breakdown zone earlier. If the upside momentum continues over the medium term, the main structural target lies at the prior swing high of 19.65.
Support Zones for Safety
For a safe approach, tracking the downside support is important. The yellow moving average line provides immediate support at 8.65. Below that, the solid structural floor is located at 7.37. These levels serve as critical invalidation marks for the current positive structure.
Watching how the stock behaves around the 10.55 to 10.70 zone will be key to deciding the next trend direction.
Disclaimer: This post is for educational purposes only and is not financial advice. I am not a SEBI-registered analyst. Please do your own research and manage your risk carefully.
The Turnaround Factors
The company has successfully cleared more than 90% of its old bank debt under its settlement agreement. Management officially expects the firm to become completely debt-free within the ongoing quarter by September. Alongside this, the operational recovery looks stable, with a 21% year-on-year growth in consolidated revenue for the recent April to June quarter. To scale up further without heavy costs, the company is in advanced talks to open up to 100 large-format franchise showrooms over the next 12 to 18 months.
Record Volume and Market Interest
The weekly chart shows a prominent rise in buying interest. A massive volume spike of 1.74 billion shares occurred during the recent positive move. This indicates a high level of fresh market participation, which usually hints at accumulators taking positions after a long consolidation period.
Key Levels and the Breakout Plan
The price is currently trading near 10.30, right below a major resistance confluence zone between 10.55 and 10.70. This zone includes a structural horizontal level and the declining purple moving average line. A clean weekly closing above 10.70 is needed to confirm a proper breakout.
Once the breakout happens and holds, the next step up points toward the intermediate resistance at 12.85, which acted as a major breakdown zone earlier. If the upside momentum continues over the medium term, the main structural target lies at the prior swing high of 19.65.
Support Zones for Safety
For a safe approach, tracking the downside support is important. The yellow moving average line provides immediate support at 8.65. Below that, the solid structural floor is located at 7.37. These levels serve as critical invalidation marks for the current positive structure.
Watching how the stock behaves around the 10.55 to 10.70 zone will be key to deciding the next trend direction.
Disclaimer: This post is for educational purposes only and is not financial advice. I am not a SEBI-registered analyst. Please do your own research and manage your risk carefully.
Trade active

WaveXplorer | Elliott Wave insights
📊 X profile: @veerappa89
📊 X profile: @veerappa89
Related publications
Disclaimer
The information and publications are not meant to be, and do not constitute, financial, investment, trading, or other types of advice or recommendations supplied or endorsed by TradingView. Read more in the Terms of Use.
WaveXplorer | Elliott Wave insights
📊 X profile: @veerappa89
📊 X profile: @veerappa89
Related publications
Disclaimer
The information and publications are not meant to be, and do not constitute, financial, investment, trading, or other types of advice or recommendations supplied or endorsed by TradingView. Read more in the Terms of Use.