
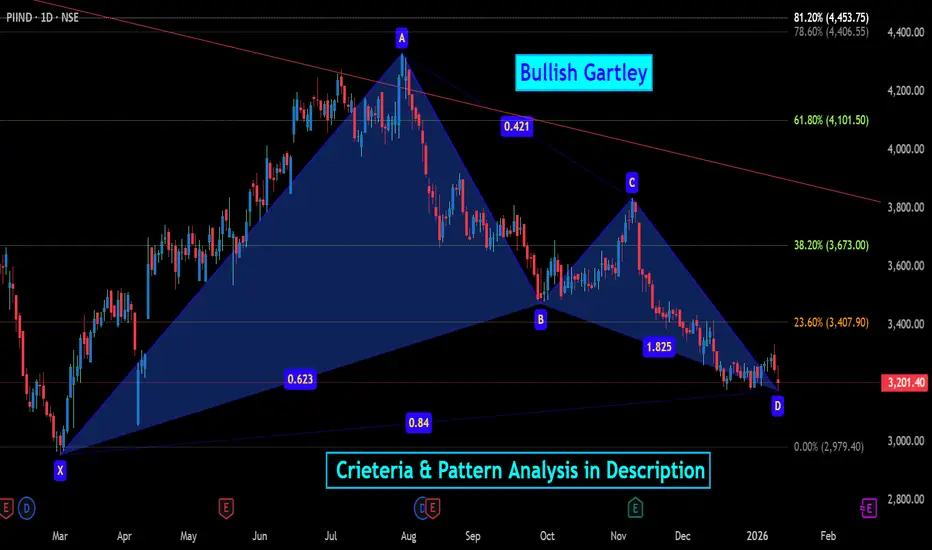
💯 Bullish Gartley Pattern in Technical Analysis
✍🏼The Bullish Gartley pattern is a harmonic trading formation rooted in Fibonacci ratios, designed to identify potential reversal points in a downtrend, signaling the start of a bullish move. Discovered by H.M. Gartley in 1935, it's part of a family of harmonic patterns (including Bat, Butterfly, and Crab) and visually resembles an 'M' shape on the chart. This pattern is popular in forex, equities, and indices like Nifty 50, where it helps traders spot high-probability entries during corrective phases. It assumes markets move in geometric proportions, blending geometry with Fibonacci sequences for precision.
________________^^^^^^^^^^^^^^^^_________________
Key Components of the Pattern
The Bullish Gartley consists of five swing points labeled X, A, B, C, and D, forming through specific Fibonacci retracements and extensions:
• XA Leg: The initial impulsive move downward from point X (high) to A (low), setting the pattern's foundation.
• AB Leg: A retracement upward from A to B, typically 61.8% of XA.
• BC Leg: A pullback downward from B to C, ranging from 38.2% to 88.6% of AB.
• CD Leg: The final extension upward from C to D, often 127.2% to 161.8% of BC, with D landing at approximately 78.6% retracement of XA.
• Potential Reversal Zone (PRZ): Convergence at D, where multiple Fib levels align for a buy signal.
👉🏼 The pattern completes when price reaches D and shows reversal signs, such as bullish candlesticks or volume increase. Here's an example chart illustrating the structure:
________________^^^^^^^^^^^^^^^^_________________
✍🏼Pattern Analysis
• Reliability: Studies show success rates of 60-80% when strict Fib ratios are met and confirmed by volume or oscillators like RSI (showing oversold at D) or MACD divergence. It's more effective in trending markets with low noise; false signals occur in choppy conditions or if ratios deviate (e.g., beyond 1-2% tolerance).
• Timeframe: Best on H4, daily, or weekly charts for positional trades; intraday (e.g., 15-min) versions are riskier due to whipsaws.
• Variations:
o Ideal ratios are precise, but real markets allow slight flexibility.
o Bullish vs. Bearish: The bearish Gartley is inverted ('W' shape) for topping patterns.
• Confirmation: Requires a breakout above the B-C high or a close above the 38.2% retracement of CD; without it, the pattern may fail and extend into other harmonics like Bat (88.6% XD).
________________^^^^^^^^^^^^^^^^_________________
🎯Implications for Trading
• Bullish Setup: Enter long positions at D with a stop-loss below X (or 1-2% below D). Targets include 38.2% and 61.8% retracements of AD, or back to point A.
• Risk-Reward: Often 1:2 or better; e.g., if XA is 100 points, risk 10-20 points for 50-100 point gains.
• In Indian Markets: For Nifty 50 (currently around 25,700 in Jan 2026), scan for Bullish Gartley near supports like 25,500 after corrections from FII selling. Combine with options (e.g., buy calls at D) for leverage.
• Risks: Over-reliance on Fibs without volume confirmation; always use in conjunction with trend analysis or fundamentals like earnings catalysts.
This pattern emphasizes discipline in waiting for completion, making it a staple for harmonic traders seeking edge in volatile environments.
⚠️ DISCLAIMER:
The information, views, and ideas shared here are purely for educational and informational purposes only. They are not intended as investment advice or a recommendation to buy, sell, or hold any financial instruments. I am not a SEBI-registered financial adviser.
Trading and investing in the stock market involves risk, and you should do your own research and analysis. You are solely responsible for any decisions made based on this research.
"As HARD EARNED MONEY IS YOUR's, So DECISION SHOULD HAVE TO BE YOUR's".
━━━━━━━━━━━━━━━━━━━━━━━━━━━━━━━━━
❇️ Follow notification about periodical View
💥 Do Comment for Stock WEEKLY Level Analysis.🚀
📊 Do you agree with this view?
✈️ HIT THE PLANE ICON if this technical observation resonates with you. It will Motivate me.
✍🏼The Bullish Gartley pattern is a harmonic trading formation rooted in Fibonacci ratios, designed to identify potential reversal points in a downtrend, signaling the start of a bullish move. Discovered by H.M. Gartley in 1935, it's part of a family of harmonic patterns (including Bat, Butterfly, and Crab) and visually resembles an 'M' shape on the chart. This pattern is popular in forex, equities, and indices like Nifty 50, where it helps traders spot high-probability entries during corrective phases. It assumes markets move in geometric proportions, blending geometry with Fibonacci sequences for precision.
________________^^^^^^^^^^^^^^^^_________________
Key Components of the Pattern
The Bullish Gartley consists of five swing points labeled X, A, B, C, and D, forming through specific Fibonacci retracements and extensions:
• XA Leg: The initial impulsive move downward from point X (high) to A (low), setting the pattern's foundation.
• AB Leg: A retracement upward from A to B, typically 61.8% of XA.
• BC Leg: A pullback downward from B to C, ranging from 38.2% to 88.6% of AB.
• CD Leg: The final extension upward from C to D, often 127.2% to 161.8% of BC, with D landing at approximately 78.6% retracement of XA.
• Potential Reversal Zone (PRZ): Convergence at D, where multiple Fib levels align for a buy signal.
👉🏼 The pattern completes when price reaches D and shows reversal signs, such as bullish candlesticks or volume increase. Here's an example chart illustrating the structure:
________________^^^^^^^^^^^^^^^^_________________
✍🏼Pattern Analysis
• Reliability: Studies show success rates of 60-80% when strict Fib ratios are met and confirmed by volume or oscillators like RSI (showing oversold at D) or MACD divergence. It's more effective in trending markets with low noise; false signals occur in choppy conditions or if ratios deviate (e.g., beyond 1-2% tolerance).
• Timeframe: Best on H4, daily, or weekly charts for positional trades; intraday (e.g., 15-min) versions are riskier due to whipsaws.
• Variations:
o Ideal ratios are precise, but real markets allow slight flexibility.
o Bullish vs. Bearish: The bearish Gartley is inverted ('W' shape) for topping patterns.
• Confirmation: Requires a breakout above the B-C high or a close above the 38.2% retracement of CD; without it, the pattern may fail and extend into other harmonics like Bat (88.6% XD).
________________^^^^^^^^^^^^^^^^_________________
🎯Implications for Trading
• Bullish Setup: Enter long positions at D with a stop-loss below X (or 1-2% below D). Targets include 38.2% and 61.8% retracements of AD, or back to point A.
• Risk-Reward: Often 1:2 or better; e.g., if XA is 100 points, risk 10-20 points for 50-100 point gains.
• In Indian Markets: For Nifty 50 (currently around 25,700 in Jan 2026), scan for Bullish Gartley near supports like 25,500 after corrections from FII selling. Combine with options (e.g., buy calls at D) for leverage.
• Risks: Over-reliance on Fibs without volume confirmation; always use in conjunction with trend analysis or fundamentals like earnings catalysts.
This pattern emphasizes discipline in waiting for completion, making it a staple for harmonic traders seeking edge in volatile environments.
⚠️ DISCLAIMER:
The information, views, and ideas shared here are purely for educational and informational purposes only. They are not intended as investment advice or a recommendation to buy, sell, or hold any financial instruments. I am not a SEBI-registered financial adviser.
Trading and investing in the stock market involves risk, and you should do your own research and analysis. You are solely responsible for any decisions made based on this research.
"As HARD EARNED MONEY IS YOUR's, So DECISION SHOULD HAVE TO BE YOUR's".
━━━━━━━━━━━━━━━━━━━━━━━━━━━━━━━━━
❇️ Follow notification about periodical View
💥 Do Comment for Stock WEEKLY Level Analysis.🚀
📊 Do you agree with this view?
✈️ HIT THE PLANE ICON if this technical observation resonates with you. It will Motivate me.
Note
Screenshot of Intraday Level for 12th Jan 2026Note
Now @ 3246+ (+1.50+) % in this Market proves Power of Reversal Pattern Screen Shot of levels Given @ 3193
Screen Shot at Current Time.

Related publications
Disclaimer
The information and publications are not meant to be, and do not constitute, financial, investment, trading, or other types of advice or recommendations supplied or endorsed by TradingView. Read more in the Terms of Use.
Related publications
Disclaimer
The information and publications are not meant to be, and do not constitute, financial, investment, trading, or other types of advice or recommendations supplied or endorsed by TradingView. Read more in the Terms of Use.