
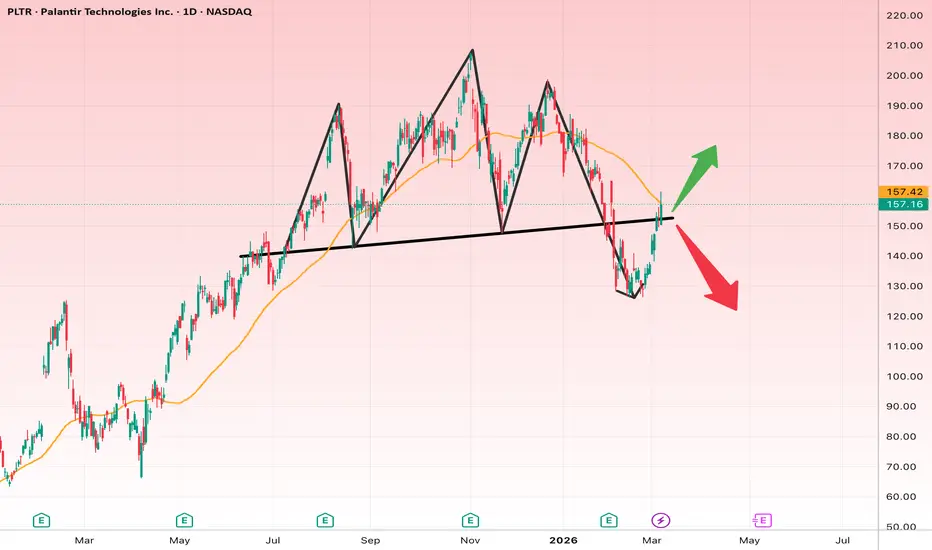
The chart is on the daily timeframe and shows a classic trendline breakdown followed by a pullback.
Key observations:
• The long-term uptrend line has been broken
• Price dropped sharply after the break
• The current move is a pullback to the broken trendline
• The moving average (orange line) is acting as resistance
This is a critical decision zone for the market.
Short-Term Outlook
The key zone is $150–$160.
Bullish Scenario
If price reclaims and holds above $160, a recovery rally is possible.
Targets:
First target
$170
Second target
$182
Third target
$195
Stop loss
$148
Bearish Scenario
If price fails to break resistance and gets rejected:
Targets:
First target
$135
Second target
$125
Third target
$110
Stop loss for short trades
$162
Long-Term Outlook
From a macro perspective, the stock still maintains a bullish structure.
Long-term targets:
First target
$200
Second target
$230
Third target
$260
Long-term stop loss
Below
$120
Fundamental Overview
Palantir Technologies operates in data analytics and artificial intelligence, two rapidly growing sectors.
Key positives:
• Strong AI market growth
• Large government contracts
• Increasing commercial revenue
• Achieved profitability
Main risks:
• High valuation
• Sensitivity to tech sector sentiment
Overall, the long-term outlook remains positive but volatile.
✅ Final Insight
The $150–$160 range is the key decision zone.
Above it → potential rally toward $180–$200
Below it → possible correction toward $125
Key observations:
• The long-term uptrend line has been broken
• Price dropped sharply after the break
• The current move is a pullback to the broken trendline
• The moving average (orange line) is acting as resistance
This is a critical decision zone for the market.
Short-Term Outlook
The key zone is $150–$160.
Bullish Scenario
If price reclaims and holds above $160, a recovery rally is possible.
Targets:
First target
$170
Second target
$182
Third target
$195
Stop loss
$148
Bearish Scenario
If price fails to break resistance and gets rejected:
Targets:
First target
$135
Second target
$125
Third target
$110
Stop loss for short trades
$162
Long-Term Outlook
From a macro perspective, the stock still maintains a bullish structure.
Long-term targets:
First target
$200
Second target
$230
Third target
$260
Long-term stop loss
Below
$120
Fundamental Overview
Palantir Technologies operates in data analytics and artificial intelligence, two rapidly growing sectors.
Key positives:
• Strong AI market growth
• Large government contracts
• Increasing commercial revenue
• Achieved profitability
Main risks:
• High valuation
• Sensitivity to tech sector sentiment
Overall, the long-term outlook remains positive but volatile.
✅ Final Insight
The $150–$160 range is the key decision zone.
Above it → potential rally toward $180–$200
Below it → possible correction toward $125

Disclaimer
The information and publications are not meant to be, and do not constitute, financial, investment, trading, or other types of advice or recommendations supplied or endorsed by TradingView. Read more in the Terms of Use.
Disclaimer
The information and publications are not meant to be, and do not constitute, financial, investment, trading, or other types of advice or recommendations supplied or endorsed by TradingView. Read more in the Terms of Use.