Palantir ( PLTR): Testing Major Support Floor – High-Probability Mean Reversion vs. Breakdown Matrix
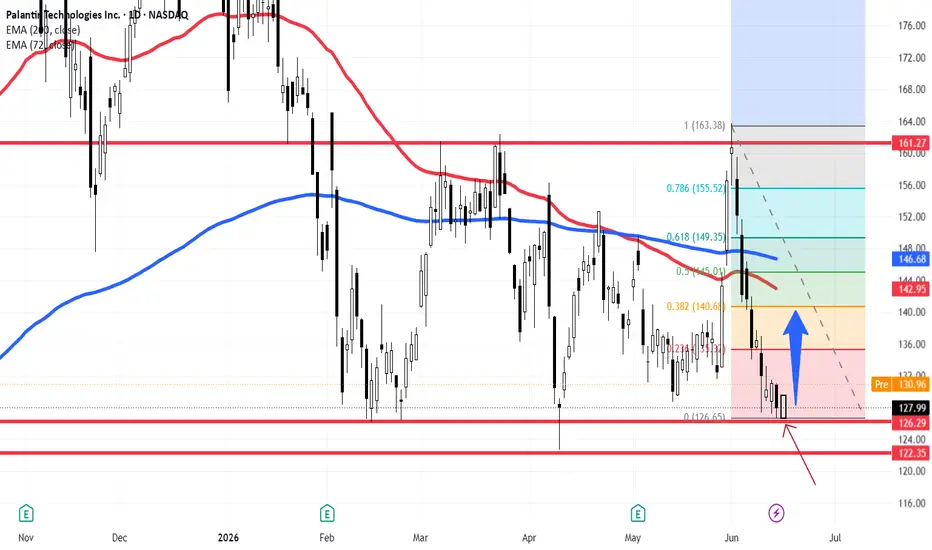
### 💻 Palantir Technologies (PLTR) Daily Technical Framework (Ref: PLTR_2026-06-15_08-57-30.png)
We are tracking a pivotal market structure inflection point on Palantir Technologies (PLTR - NASDAQ) as price action descends directly into a major multi-month institutional support floor.
The current daily session is trading down **-2.36% at 127.99**, aggressively testing the solid red horizontal baseline at **126.29**, which precisely aligns with our local **0 Fibonacci retracement layer at 126.65**.
As we approach this key technical junction, we have structured two highly defined execution playbooks based on systematic price confirmation:
---
### 📈 Playbook A: Structural Mean-Reversion (The Higher Probability Vector)
* **The Trigger:** We are closely monitoring the daily candle close. If buyers defend this floor, printing a strong bullish rejection candlestick signature prior to any breakdown, a tactical long setup is triggered.
* **The Technical Target Zone:** The resulting upward squeeze (indicated by the solid blue vector) targets a highly confluent dynamic magnet zone between **$142.00 and $146.00**.
* **Confluence Metrics:** This premium target area is bound by the **0.5 Fibonacci level (145.01)**, the descending **72-period EMA (red line at 142.95)**, and the long-term institutional baseline—the **200-period EMA (blue line at 146.68)**.
### 📉 Playbook B: Sustained Support Breakdown (The Continuation Short)
* **The Trigger:** If selling pressure forces a clean, decisive daily breakdown below the **126.29** horizontal floor over the coming sessions, the local bullish thesis is entirely invalidated.
* **The Execution Protocol:** To prevent chasing late distribution liquidity, we will remain patient. We will wait for a structural pullback back up to the broken baseline—confirming the old support has officially flipped into overhead supply resistance—before executing a short entry.
* **The Target:** A verified rejection on the retest opens the path down toward the next historical demand layer at the horizontal line of **122.35**.
### Tactical Summary:
While a breakdown is entirely possible, the current momentum profile and structural location suggest that an overextended mean-reversion pop back toward the EMA cluster represents the path of least resistance. We will let the daily print finalize today to validate our initial trigger.
---
📊 **ChartPro Data** | By Rogerio Zaglia
*Systematic Equity Research, Market Geometry & Quantitative Risk Management.*
⚠️ **Disclaimer:** For educational and informational purposes only. This technical analysis represents a personal trading framework and does not constitute financial or investment advice.
PLTR): Testing Major Support Floor – High-Probability Mean Reversion vs. Breakdown Matrix### 💻 Palantir Technologies (
PLTR) Daily Technical Framework (Ref: PLTR_2026-06-15_08-57-30.png)We are tracking a pivotal market structure inflection point on Palantir Technologies (
PLTR - NASDAQ) as price action descends directly into a major multi-month institutional support floor. The current daily session is trading down **-2.36% at 127.99**, aggressively testing the solid red horizontal baseline at **126.29**, which precisely aligns with our local **0 Fibonacci retracement layer at 126.65**.
As we approach this key technical junction, we have structured two highly defined execution playbooks based on systematic price confirmation:
---
### 📈 Playbook A: Structural Mean-Reversion (The Higher Probability Vector)
* **The Trigger:** We are closely monitoring the daily candle close. If buyers defend this floor, printing a strong bullish rejection candlestick signature prior to any breakdown, a tactical long setup is triggered.
* **The Technical Target Zone:** The resulting upward squeeze (indicated by the solid blue vector) targets a highly confluent dynamic magnet zone between **$142.00 and $146.00**.
* **Confluence Metrics:** This premium target area is bound by the **0.5 Fibonacci level (145.01)**, the descending **72-period EMA (red line at 142.95)**, and the long-term institutional baseline—the **200-period EMA (blue line at 146.68)**.
### 📉 Playbook B: Sustained Support Breakdown (The Continuation Short)
* **The Trigger:** If selling pressure forces a clean, decisive daily breakdown below the **126.29** horizontal floor over the coming sessions, the local bullish thesis is entirely invalidated.
* **The Execution Protocol:** To prevent chasing late distribution liquidity, we will remain patient. We will wait for a structural pullback back up to the broken baseline—confirming the old support has officially flipped into overhead supply resistance—before executing a short entry.
* **The Target:** A verified rejection on the retest opens the path down toward the next historical demand layer at the horizontal line of **122.35**.
### Tactical Summary:
While a breakdown is entirely possible, the current momentum profile and structural location suggest that an overextended mean-reversion pop back toward the EMA cluster represents the path of least resistance. We will let the daily print finalize today to validate our initial trigger.
---
📊 **ChartPro Data** | By Rogerio Zaglia
*Systematic Equity Research, Market Geometry & Quantitative Risk Management.*
⚠️ **Disclaimer:** For educational and informational purposes only. This technical analysis represents a personal trading framework and does not constitute financial or investment advice.

Disclaimer
The information and publications are not meant to be, and do not constitute, financial, investment, trading, or other types of advice or recommendations supplied or endorsed by TradingView. Read more in the Terms of Use.
Disclaimer
The information and publications are not meant to be, and do not constitute, financial, investment, trading, or other types of advice or recommendations supplied or endorsed by TradingView. Read more in the Terms of Use.