
Chart Analysis & Reasoning:
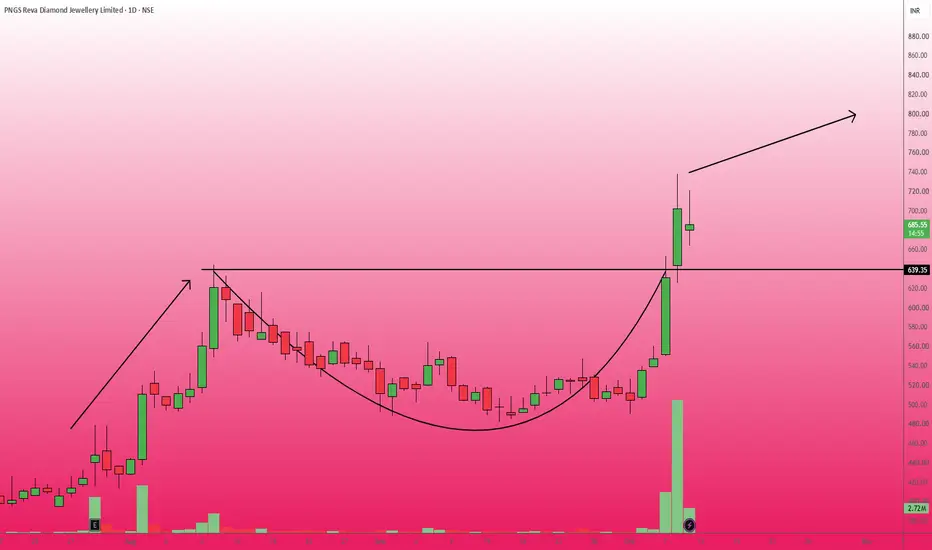
As seen on the daily timeframe, PNGS has staged a powerful breakout from a multi-month rounding bottom (or "cup") pattern.
The neckline resistance was firmly established at the 639.35 level.
This recent breakout is highly significant because it is accompanied by a massive surge in buying volume (noted by the prominent green volume spike), signaling strong bullish conviction and market participation.
The price has comfortably cleared the resistance, transforming the 639 level into a new structural support zone.
Trade Setup & Key Levels:
Entry Point: With the stock currently trading around 686.90, an aggressive entry can be considered near the Current Market Price (CMP).
Alternatively, for a more conservative risk-to-reward ratio, traders can look to accumulate on a potential pullback or retest of the breakout zone between 640.00 and 660.00.
Target (TP): Using the measured move technique for a rounding bottom, we calculate the depth of the pattern—which is roughly 160 points (from the base near 480 to the neckline at 639).
Projecting this depth upwards from the breakout level provides a conservative technical target of 800.00.
Stop Loss (SL): To maintain proper risk management, a strict stop loss should be placed near 615.00 (just below the breakout candle's base and recent consolidation).
A daily close below this level would indicate a false breakout and invalidate the bullish thesis.
As seen on the daily timeframe, PNGS has staged a powerful breakout from a multi-month rounding bottom (or "cup") pattern.
The neckline resistance was firmly established at the 639.35 level.
This recent breakout is highly significant because it is accompanied by a massive surge in buying volume (noted by the prominent green volume spike), signaling strong bullish conviction and market participation.
The price has comfortably cleared the resistance, transforming the 639 level into a new structural support zone.
Trade Setup & Key Levels:
Entry Point: With the stock currently trading around 686.90, an aggressive entry can be considered near the Current Market Price (CMP).
Alternatively, for a more conservative risk-to-reward ratio, traders can look to accumulate on a potential pullback or retest of the breakout zone between 640.00 and 660.00.
Target (TP): Using the measured move technique for a rounding bottom, we calculate the depth of the pattern—which is roughly 160 points (from the base near 480 to the neckline at 639).
Projecting this depth upwards from the breakout level provides a conservative technical target of 800.00.
Stop Loss (SL): To maintain proper risk management, a strict stop loss should be placed near 615.00 (just below the breakout candle's base and recent consolidation).
A daily close below this level would indicate a false breakout and invalidate the bullish thesis.
Trade closed: stop reached
Stoploss hit..
Disclaimer
The information and publications are not meant to be, and do not constitute, financial, investment, trading, or other types of advice or recommendations supplied or endorsed by TradingView. Read more in the Terms of Use.
Disclaimer
The information and publications are not meant to be, and do not constitute, financial, investment, trading, or other types of advice or recommendations supplied or endorsed by TradingView. Read more in the Terms of Use.