 POLYMED
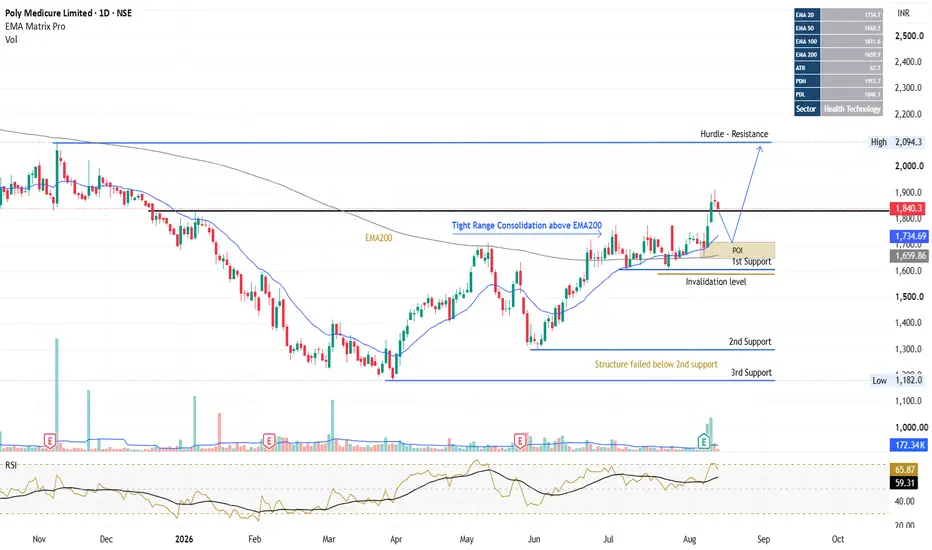
 Breakout & Expansion: The daily chart demonstrates a clear shift from a multi-month markdown into an aggressive expansion phase. The daily candle 11Aug ₹1,863.9 (+5.16%) cleanly breaks above the local hurdle/resistance zone around ₹1,820–₹1,840.
EMA Reclaim: Price action has reclaimed the 200 EMA (₹1,659), 50 EMA (₹1,660), and 20 EMA (₹1,734), signifying a short-to-medium-term alignment flip back to bullish.
Point of Interest (POI) & Liquidity: Before this breakout candle, price consolidated directly above the 200 EMA, establishing a structured POI / Demand Zone around ₹1,708 – ₹1,655.
RSI Dynamics: Daily RSI started cool off . While this signals strong short-term buying momentum, entering at current peaks carries elevated risk; waiting for pullbacks toward key supports offers a better risk-reward ratio.
Key Technical Levels
Immediate Resistance: ₹1,897 & ₹2,100 (Macro Swing Resistance)
Point of Interest / Support 1: ₹1,708 – ₹1,655 (20 EMA / 200 EMA Base)
Structure Invalidation Level: ₹1,586 (Daily Close below invalidates short-term setup)
Structure Failure Level: Below ₹1,300 (Close below 2nd Support invalidates Long-term setup)
Disclaimer
The following analysis is strictly for educational purposes and reflects my personal observations on market structure and price action. I am an unregistered individual analyst and trader. This is NOT financial advice or a buy/sell recommendation. Please conduct your own research and practice strict risk management before entering any trade.
Trade active
Update after 45 days. Long-term structure - Constructive
EMA alignment - Constructive
POI - Still holding
RSI - Neutral
Stage - Price compression at POI and potentially preparing for expansion

Disclaimer
The information and publications are not meant to be, and do not constitute, financial, investment, trading, or other types of advice or recommendations supplied or endorsed by TradingView. Read more in the Terms of Use.
Disclaimer
The information and publications are not meant to be, and do not constitute, financial, investment, trading, or other types of advice or recommendations supplied or endorsed by TradingView. Read more in the Terms of Use.