
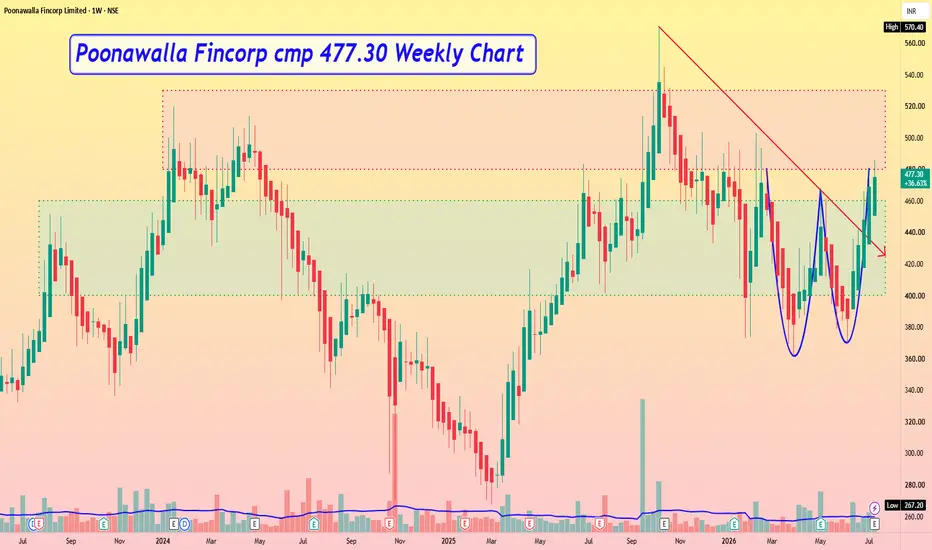
Poonawalla Fincorp cmp 477.30 Weekly Chart
- Support Zone 400 to 460 Price Band
- Resistance Zone 480 to 535 Price Band
- Bullish "W" Double Bottom pattern formed
- Breakout sustained from Resistance Trendline
- Volumes keeping in close sync of avg traded qty
- Support Zone 400 to 460 Price Band
- Resistance Zone 480 to 535 Price Band
- Bullish "W" Double Bottom pattern formed
- Breakout sustained from Resistance Trendline
- Volumes keeping in close sync of avg traded qty

Disclaimer
The information and publications are not meant to be, and do not constitute, financial, investment, trading, or other types of advice or recommendations supplied or endorsed by TradingView. Read more in the Terms of Use.
Disclaimer
The information and publications are not meant to be, and do not constitute, financial, investment, trading, or other types of advice or recommendations supplied or endorsed by TradingView. Read more in the Terms of Use.