
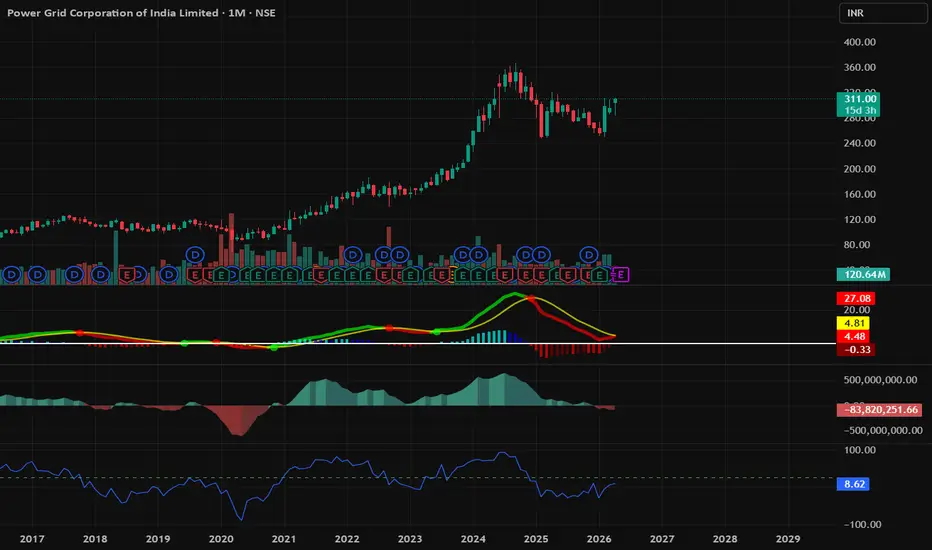
📈 POWERGRID – Power Grid Corporation of India Limited | Monthly Bullish Momentum
Chart Type: 1M (Monthly)
CMP: ₹310.85
Breakout Confirmation: Sustaining above ₹300 (Previous consolidation peak)
Support Zone: ₹275 – ₹283
Trend Structure: Strong secular uptrend with clear "Step-up" patterns intact.
🔍 Technical View
Bullish Resilience: After a brief corrective phase/consolidation, the stock is reclaiming its highs, forming a bullish engulfing-style structure on the monthly candle.
Indicator Alignment: The price remains comfortably above the EMA ribbon and Supertrend support (teal dots), indicating that the primary long-term trend is firmly intact.
MACD Dynamics: While the MACD histogram shows a period of cooling off, the signal lines remain well above the zero line, suggesting a "buy on dips" environment rather than a trend reversal.
RSI Strength: The RSI (currently at 68.51) is holding steady in the bullish territory, showing room for further expansion before hitting extreme overbought levels.
Volume Support: Consistent volume clusters throughout the rally indicate steady institutional accumulation over the years.
🎯 Targets (Positional / Long-Term)
Level Target Zone Comment
T1 ₹345 Immediate resistance and recent swing high
T2 ₹380 Psychological milestone and trend extension
T3 ₹420+ Long-term structural projection
⚠️ Risk Management
Stop-loss: ₹265 (Monthly Closing Basis)
Caution: Watch for any distribution patterns near the ₹320–₹330 zone; failure to clear ₹320 might lead to further sideways consolidation.
Strategy: Ideal for long-term portfolio allocation and trend-following swing traders.
🧭 Conclusion
Power Grid continues to exhibit classic "Trend Continuation" behavior. The stock has successfully absorbed selling pressure and is now attempting to enter a new price discovery phase. With the energy sector seeing renewed interest, the technical alignment of price staying above its monthly trend ribbons suggests that the path of least resistance remains upward.

Disclaimer
The information and publications are not meant to be, and do not constitute, financial, investment, trading, or other types of advice or recommendations supplied or endorsed by TradingView. Read more in the Terms of Use.
Disclaimer
The information and publications are not meant to be, and do not constitute, financial, investment, trading, or other types of advice or recommendations supplied or endorsed by TradingView. Read more in the Terms of Use.