
PRECWIRE Bullish Breakout & Retest of Resistance-Turned-Support
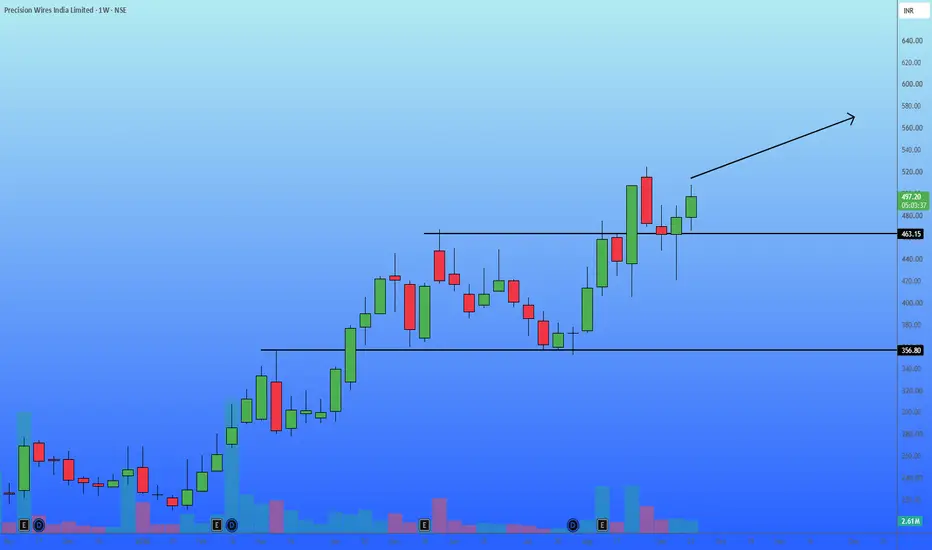
Based on the weekly chart for Precision Wires India Limited, the stock is demonstrating a textbook technical breakout setup.
Chart Analysis
Breakout & Retest: The price recently broke out above a major multi-month resistance ceiling at 463.15.
Following the breakout, the stock experienced a healthy pullback, retesting the 463.15 level.
This zone has now successfully flipped from resistance to strong support.
Price Action: The latest weekly candle (currently at 498.15) shows a bullish bounce off the new support zone, indicating that buyers are actively defending this level.
Trend & Volume: The broader trend remains heavily bullish, established by the higher lows originating from the secondary support base at 356.80.
Volume profiles during the upward moves validate the buying interest.
Trade Setup
Entry Point: Current Market Price around 498.15, or accumulate on minor pullbacks between 480.00 – 495.00.
Target: 570.00. This target is derived using a measured move of the previous consolidation range (approximately 106 points from 356.80 to 463.15, projected upward from the breakout level).
Stop Loss: 445.00 (Strictly on a Weekly Closing Basis).
This placement ensures you are not wicked out by intraday volatility, but invalidates the bullish thesis if the price closes back below the 463.15 support level and recent swing lows.
Chart Analysis
Breakout & Retest: The price recently broke out above a major multi-month resistance ceiling at 463.15.
Following the breakout, the stock experienced a healthy pullback, retesting the 463.15 level.
This zone has now successfully flipped from resistance to strong support.
Price Action: The latest weekly candle (currently at 498.15) shows a bullish bounce off the new support zone, indicating that buyers are actively defending this level.
Trend & Volume: The broader trend remains heavily bullish, established by the higher lows originating from the secondary support base at 356.80.
Volume profiles during the upward moves validate the buying interest.
Trade Setup
Entry Point: Current Market Price around 498.15, or accumulate on minor pullbacks between 480.00 – 495.00.
Target: 570.00. This target is derived using a measured move of the previous consolidation range (approximately 106 points from 356.80 to 463.15, projected upward from the breakout level).
Stop Loss: 445.00 (Strictly on a Weekly Closing Basis).
This placement ensures you are not wicked out by intraday volatility, but invalidates the bullish thesis if the price closes back below the 463.15 support level and recent swing lows.
Trade closed: stop reached
Stoploss hit..
Disclaimer
The information and publications are not meant to be, and do not constitute, financial, investment, trading, or other types of advice or recommendations supplied or endorsed by TradingView. Read more in the Terms of Use.
Disclaimer
The information and publications are not meant to be, and do not constitute, financial, investment, trading, or other types of advice or recommendations supplied or endorsed by TradingView. Read more in the Terms of Use.