
Key Chart Observations
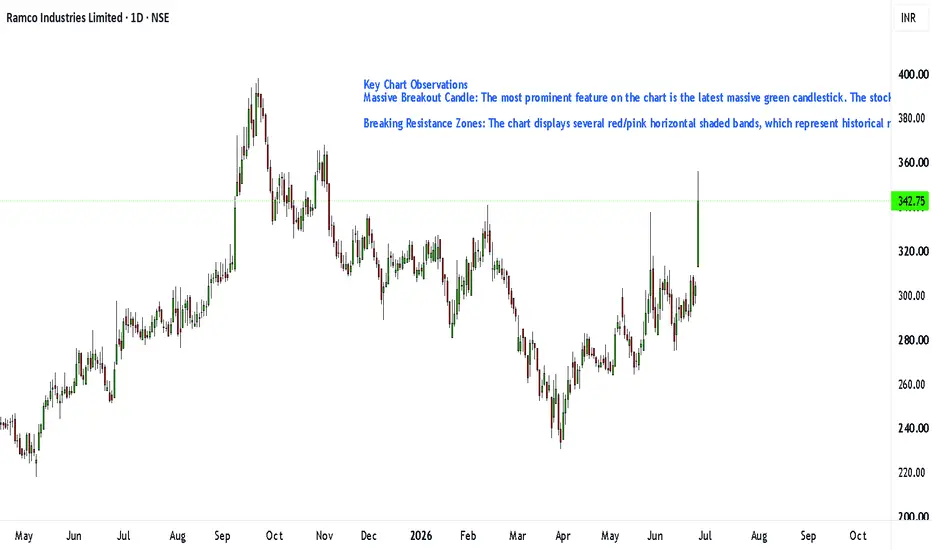
Massive Breakout Candle: The most prominent feature on the chart is the latest massive green candlestick. The stock opened at 313.00 and surged to a high of 356.00 before closing at 342.75, representing a massive ~12.7% intraday gain. This indicates overwhelming buying pressure and a significant momentum shift.
Breaking Resistance Zones: The chart displays several red/pink horizontal shaded bands, which represent historical resistance and supply zones. The recent price action aggressively shattered the major resistance cluster around the 313.00 - 320.00 level, turning this previous ceiling into potential new support.
Massive Breakout Candle: The most prominent feature on the chart is the latest massive green candlestick. The stock opened at 313.00 and surged to a high of 356.00 before closing at 342.75, representing a massive ~12.7% intraday gain. This indicates overwhelming buying pressure and a significant momentum shift.
Breaking Resistance Zones: The chart displays several red/pink horizontal shaded bands, which represent historical resistance and supply zones. The recent price action aggressively shattered the major resistance cluster around the 313.00 - 320.00 level, turning this previous ceiling into potential new support.

Automated Tools/Indicators/Screeners available at kkonline.org/nimblrta
Disclaimer
The information and publications are not meant to be, and do not constitute, financial, investment, trading, or other types of advice or recommendations supplied or endorsed by TradingView. Read more in the Terms of Use.
Automated Tools/Indicators/Screeners available at kkonline.org/nimblrta
Disclaimer
The information and publications are not meant to be, and do not constitute, financial, investment, trading, or other types of advice or recommendations supplied or endorsed by TradingView. Read more in the Terms of Use.