
Overview
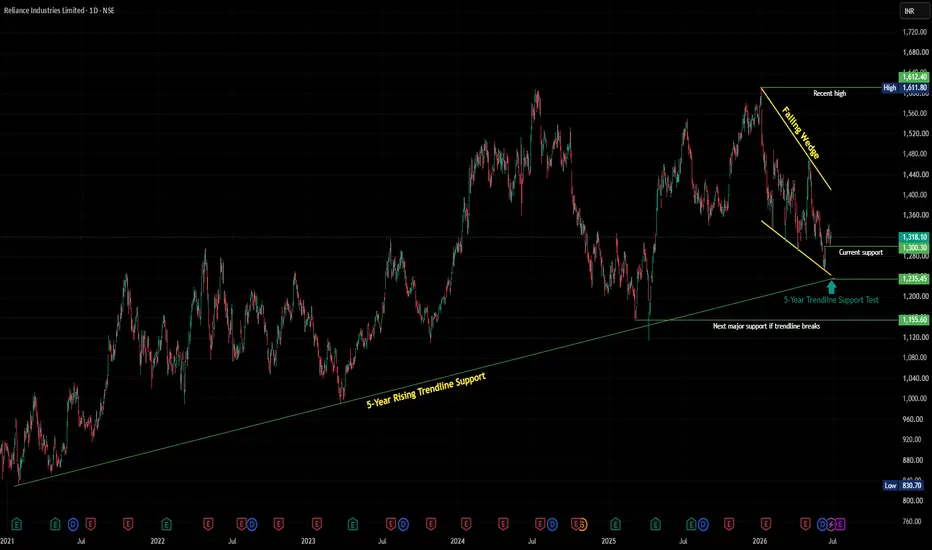
Reliance Industries — India's most watched stock — is currently sitting at one of the most significant technical junctions in the last 5 years. A long-term rising trendline that has held since 2021 is being tested simultaneously with a Falling Wedge pattern forming on the Daily chart. The confluence of these two structures makes the current price zone exceptionally important.
Structure 1 — The 5-Year Rising Trendline
Since the 2021 low of ₹830, Reliance has respected a clean rising trendline connecting each major swing low over 5 years. This trendline has been tested multiple times and has held every single time — making it one of the most reliable support structures on the Daily chart.
Current price at ₹1,318 is sitting right on this trendline — making this the most critical trendline test in recent memory.
A trendline that has held for 5 years and is being tested again carries enormous technical significance. The reaction here will define Reliance's trajectory for the coming months.
Structure 2 — Falling Wedge (Short Term)
Simultaneously, a Falling Wedge has formed on the Daily chart from the recent high of ₹1,611. Two downward-sloping converging lines have been compressing price since early 2026.
The Falling Wedge is classically a bullish reversal pattern — it signals exhaustion of selling pressure. When combined with a major long-term trendline support, the bullish case becomes significantly stronger.

(See zoomed chart in description for clearer wedge structure)
Key Levels
🔴 Recent High — 1,611
🟡 Current Resistance — 1,300 (now being tested as support)
🟢 5-Year Trendline Support Test — 1,235 (dynamic, rising)
🟢 Next Major Support if trendline breaks — 1,155
Two Scenarios
🟢 Scenario A — Trendline Holds + Wedge Breakout
Price respects the 5-year trendline and the Falling Wedge breaks upward. First target is reclaiming ₹1,300, then ₹1,400, with ₹1,611 as the ultimate resistance to clear. This would be a classic trendline bounce + wedge breakout combination.
🔴 Scenario B — Trendline Breaks
If price closes decisively below the 5-year trendline on a daily basis, this would be a significant structural breakdown for Reliance. Next support levels come at ₹1,235 and ₹1,155. A breakdown of a 5-year trendline would signal a major shift in long-term sentiment.
Why This Matters Beyond Reliance
Reliance Industries carries approximately 10% weight in NIFTY 50. A major move in Reliance — up or down — directly impacts the index. This is not just a stock analysis — it is a macro signal for the broader Indian market.
If Reliance bounces here, it adds a tailwind to NIFTY. If it breaks down, it becomes a headwind. Watch this level closely regardless of whether you trade Reliance directly.
What This Setup Teaches
Long-term trendlines are not drawn in days — they are built over years of price action. The longer a trendline holds, the more significant the next test becomes. When a short-term pattern like a Falling Wedge aligns with a long-term trendline at the same price zone, it creates a high-probability confluence that demands attention.
This is why multi-timeframe analysis matters — the short-term pattern tells you the timing, the long-term trendline tells you the significance.
Conclusion
Reliance is at a make-or-break level. The 5-year trendline has held every test since 2021. The Falling Wedge is compressing price into a decision point. The next few daily candles will determine whether this becomes a launchpad or a breakdown.
You may love Reliance or hate it — but right now, you cannot ignore it.
For educational purposes only. Not financial advice. Always manage your risk.
Reliance Industries — India's most watched stock — is currently sitting at one of the most significant technical junctions in the last 5 years. A long-term rising trendline that has held since 2021 is being tested simultaneously with a Falling Wedge pattern forming on the Daily chart. The confluence of these two structures makes the current price zone exceptionally important.
Structure 1 — The 5-Year Rising Trendline
Since the 2021 low of ₹830, Reliance has respected a clean rising trendline connecting each major swing low over 5 years. This trendline has been tested multiple times and has held every single time — making it one of the most reliable support structures on the Daily chart.
Current price at ₹1,318 is sitting right on this trendline — making this the most critical trendline test in recent memory.
A trendline that has held for 5 years and is being tested again carries enormous technical significance. The reaction here will define Reliance's trajectory for the coming months.
Structure 2 — Falling Wedge (Short Term)
Simultaneously, a Falling Wedge has formed on the Daily chart from the recent high of ₹1,611. Two downward-sloping converging lines have been compressing price since early 2026.
The Falling Wedge is classically a bullish reversal pattern — it signals exhaustion of selling pressure. When combined with a major long-term trendline support, the bullish case becomes significantly stronger.
(See zoomed chart in description for clearer wedge structure)
Key Levels
🔴 Recent High — 1,611
🟡 Current Resistance — 1,300 (now being tested as support)
🟢 5-Year Trendline Support Test — 1,235 (dynamic, rising)
🟢 Next Major Support if trendline breaks — 1,155
Two Scenarios
🟢 Scenario A — Trendline Holds + Wedge Breakout
Price respects the 5-year trendline and the Falling Wedge breaks upward. First target is reclaiming ₹1,300, then ₹1,400, with ₹1,611 as the ultimate resistance to clear. This would be a classic trendline bounce + wedge breakout combination.
🔴 Scenario B — Trendline Breaks
If price closes decisively below the 5-year trendline on a daily basis, this would be a significant structural breakdown for Reliance. Next support levels come at ₹1,235 and ₹1,155. A breakdown of a 5-year trendline would signal a major shift in long-term sentiment.
Why This Matters Beyond Reliance
Reliance Industries carries approximately 10% weight in NIFTY 50. A major move in Reliance — up or down — directly impacts the index. This is not just a stock analysis — it is a macro signal for the broader Indian market.
If Reliance bounces here, it adds a tailwind to NIFTY. If it breaks down, it becomes a headwind. Watch this level closely regardless of whether you trade Reliance directly.
What This Setup Teaches
Long-term trendlines are not drawn in days — they are built over years of price action. The longer a trendline holds, the more significant the next test becomes. When a short-term pattern like a Falling Wedge aligns with a long-term trendline at the same price zone, it creates a high-probability confluence that demands attention.
This is why multi-timeframe analysis matters — the short-term pattern tells you the timing, the long-term trendline tells you the significance.
Conclusion
Reliance is at a make-or-break level. The 5-year trendline has held every test since 2021. The Falling Wedge is compressing price into a decision point. The next few daily candles will determine whether this becomes a launchpad or a breakdown.
You may love Reliance or hate it — but right now, you cannot ignore it.
For educational purposes only. Not financial advice. Always manage your risk.
Note
Update — 5-Year Trendline Holding, Now Above the 50 EMA
Quick update on this one. Reliance is holding the 5-year trendline support we flagged earlier, and a good sign — price is up 2.36%, closing at 1,327.20, which is now above the 50 EMA (1,321.68).
That's a small win. But there's more work to do before we get excited.
What to watch next:
Can price hold above the 50 EMA for a few more sessions, not just one day? A single close above isn't enough to confirm yet
The falling wedge resistance and the 200 EMA (1,378.42) are still sitting above — that's the bigger test coming up
The 5-year trendline support below (~1,240-1,260 zone) remains the key level if this bounce fades
Bottom line: good first step — trendline held, 50 EMA reclaimed. But the real test is whether price can push through the wedge resistance and 200 EMA above. As always, we wait for confirmation before getting ahead of ourselves.
For educational purposes only. Not financial advice. Always manage your risk.

📈 HK Trading Community | Market Structure & Indicator Updates
Telegram: t.me/trendstrike1000
Website: quantumedgepro.netlify.app/
Real traders are built through learning,not tip hunting.So Start Learning How the Market Really Works
Telegram: t.me/trendstrike1000
Website: quantumedgepro.netlify.app/
Real traders are built through learning,not tip hunting.So Start Learning How the Market Really Works
Disclaimer
The information and publications are not meant to be, and do not constitute, financial, investment, trading, or other types of advice or recommendations supplied or endorsed by TradingView. Read more in the Terms of Use.
📈 HK Trading Community | Market Structure & Indicator Updates
Telegram: t.me/trendstrike1000
Website: quantumedgepro.netlify.app/
Real traders are built through learning,not tip hunting.So Start Learning How the Market Really Works
Telegram: t.me/trendstrike1000
Website: quantumedgepro.netlify.app/
Real traders are built through learning,not tip hunting.So Start Learning How the Market Really Works
Disclaimer
The information and publications are not meant to be, and do not constitute, financial, investment, trading, or other types of advice or recommendations supplied or endorsed by TradingView. Read more in the Terms of Use.