
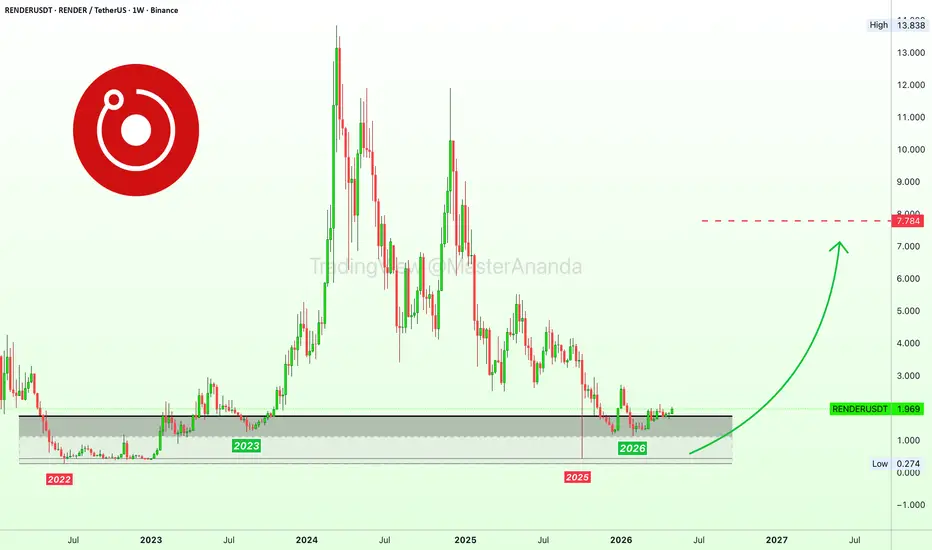
Here we are looking at bottom prices and long-term support, searching for bullish potential and growth opportunity, a good trade with low risk vs a high potential for reward. It is a done deal.
RENDERUSDT trades above long-term support. I am using the linear chart because it reflects better how low this project is actually trading and removed the volume since it is irrelevant for this analysis.
In 2022, extremely low prices became active for a long while, then again in 2023 as a higher low. This process is repeated in the present cycle after a prolonged bear market.
In 2025, RENDERUSDT reached prices similar to 2022 but only briefly. Then again in 2026 the action moved below long-term support but as a higher low, now the project is back within the bullish zone where long-term growth is possible.
Above the black line on the chart strong bullish conditions can develop, an uptrend, and even a new all-time high.
There is a huge difference between now and 2022-2023. Back then, the bottom levels were active for an entire year first then a revisit. This time, the bottom levels were active for a few hours only in 2025 and then several weeks in 2026. This shows the presence of buyers and the unwillingness of the market to let prices dive any deeper.
With long-term support confirmed, we can expect a new market phase, an uptrend.
Thank you for reading.
Namaste.

💯 Trading signals (results)
— Late 2026👇
t.me/masteranandatrades/9279
🔥 10-25X Leverage
—Trade-numbers:
t.me/masteranandatrades/9271
✅ PREMIUM &Content
—One-Time Payment
t.me/lamatrades/4 (🔝 since 2017)
— Late 2026👇
t.me/masteranandatrades/9279
🔥 10-25X Leverage
—Trade-numbers:
t.me/masteranandatrades/9271
✅ PREMIUM &Content
—One-Time Payment
t.me/lamatrades/4 (🔝 since 2017)
Related publications
Disclaimer
The information and publications are not meant to be, and do not constitute, financial, investment, trading, or other types of advice or recommendations supplied or endorsed by TradingView. Read more in the Terms of Use.