
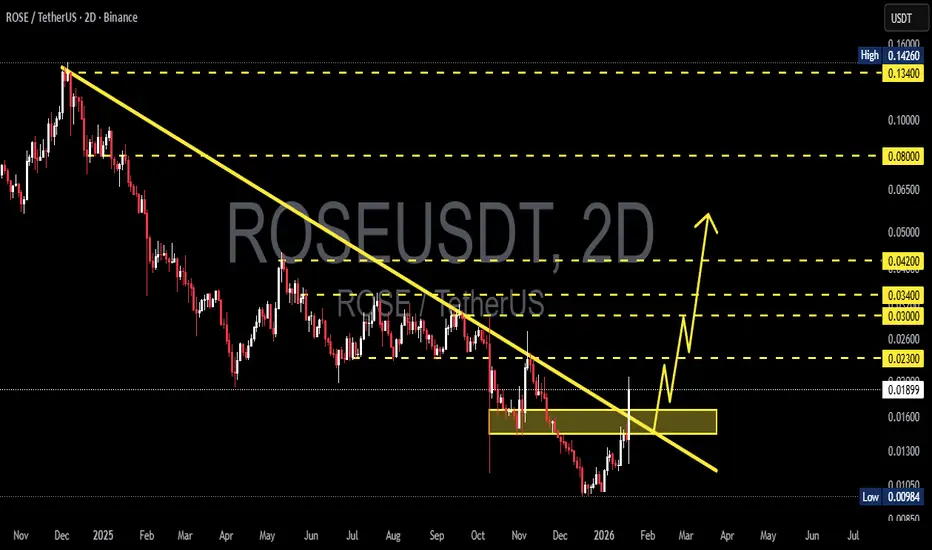
ROSE/USDT remains in a medium- to long-term bearish structure, characterized by a clear sequence of lower highs and lower lows since the late-2024 peak. Price is currently reacting around the historical demand zone at 0.0167 – 0.0144, which previously acted as an accumulation area before a major breakdown.
The 2D timeframe confirms that this move is not short-term noise, but a key structural phase.
---
Structure & Technical Pattern
1. Descending Trendline (Major Resistance)
The descending trendline is drawn from the ATH around 0.14 through subsequent lower highs.
Price is testing the trendline from below, indicating a resistance retest, not a confirmed breakout.
2. Breakdown – Retest Structure
Price previously experienced a strong breakdown below the 0.023–0.020 zone.
After forming a lower low near 0.0098, price bounced and is now retesting the former supply area (yellow box).
3. Yellow Zone (0.0167 – 0.0144)
This zone is critical because:
It represents former support turned resistance
It was a consolidation area before further distribution
It acts as a decision zone between structural reversal and bearish continuation
---
Key Levels
Resistance:
0.0167 – 0.0180 (yellow zone + trendline)
0.0230
0.0300
0.0340
0.0420
Support:
0.0144 (lower boundary of the yellow zone)
0.0120
0.0098 (major low / last demand)
---
Bullish Scenario
Primary conditions:
A strong daily/2D close above 0.0180
Break and hold above the descending trendline
Bullish confirmation:
Formation of a higher low above 0.0144
Increasing volume during the breakout
Upside targets:
0.0230
0.0300
0.0340
0.0420 (next major resistance)
Bullish meaning: Such a breakout would signal the end of the prolonged bearish channel and open the door for a medium-term trend reversal.
---
Bearish Scenario
If price fails at the yellow zone:
Rejection or long upper wicks around 0.0167–0.0180
Price closes back below 0.0144
Downside targets:
0.0120
0.0098 (previous low)
Extended bearish risk:
A breakdown below 0.0098 would lead to bearish continuation and downside price discovery
The broader downtrend remains intact
---
Conclusion
ROSE/USDT is currently trading within a major decision area.
The 0.0167 – 0.0144 zone represents a critical battle zone between buyers and sellers.
Break and hold above the trendline → reversal potential
Rejection at the yellow zone → pullback before further downside
Waiting for candle confirmation is essential, rather than anticipating direction inside the zone.
#ROSEUSDT #ROSE #CryptoAnalysis #Altcoin #DescendingTrendline #BreakoutOrReject #SupplyDemand #Downtrend #TrendReversal
The 2D timeframe confirms that this move is not short-term noise, but a key structural phase.
---
Structure & Technical Pattern
1. Descending Trendline (Major Resistance)
The descending trendline is drawn from the ATH around 0.14 through subsequent lower highs.
Price is testing the trendline from below, indicating a resistance retest, not a confirmed breakout.
2. Breakdown – Retest Structure
Price previously experienced a strong breakdown below the 0.023–0.020 zone.
After forming a lower low near 0.0098, price bounced and is now retesting the former supply area (yellow box).
3. Yellow Zone (0.0167 – 0.0144)
This zone is critical because:
It represents former support turned resistance
It was a consolidation area before further distribution
It acts as a decision zone between structural reversal and bearish continuation
---
Key Levels
Resistance:
0.0167 – 0.0180 (yellow zone + trendline)
0.0230
0.0300
0.0340
0.0420
Support:
0.0144 (lower boundary of the yellow zone)
0.0120
0.0098 (major low / last demand)
---
Bullish Scenario
Primary conditions:
A strong daily/2D close above 0.0180
Break and hold above the descending trendline
Bullish confirmation:
Formation of a higher low above 0.0144
Increasing volume during the breakout
Upside targets:
0.0230
0.0300
0.0340
0.0420 (next major resistance)
Bullish meaning: Such a breakout would signal the end of the prolonged bearish channel and open the door for a medium-term trend reversal.
---
Bearish Scenario
If price fails at the yellow zone:
Rejection or long upper wicks around 0.0167–0.0180
Price closes back below 0.0144
Downside targets:
0.0120
0.0098 (previous low)
Extended bearish risk:
A breakdown below 0.0098 would lead to bearish continuation and downside price discovery
The broader downtrend remains intact
---
Conclusion
ROSE/USDT is currently trading within a major decision area.
The 0.0167 – 0.0144 zone represents a critical battle zone between buyers and sellers.
Break and hold above the trendline → reversal potential
Rejection at the yellow zone → pullback before further downside
Waiting for candle confirmation is essential, rather than anticipating direction inside the zone.
#ROSEUSDT #ROSE #CryptoAnalysis #Altcoin #DescendingTrendline #BreakoutOrReject #SupplyDemand #Downtrend #TrendReversal

✅ Get Free Signals! Join Our Telegram Channel Here: t.me/TheCryptoNuclear
✅ Twitter: twitter.com/crypto_nuclear
✅ Join Bybit : partner.bybit.com/b/nuclearvip
✅ Benefits : Lifetime Trading Fee Discount -50%
✅ Twitter: twitter.com/crypto_nuclear
✅ Join Bybit : partner.bybit.com/b/nuclearvip
✅ Benefits : Lifetime Trading Fee Discount -50%
Disclaimer
The information and publications are not meant to be, and do not constitute, financial, investment, trading, or other types of advice or recommendations supplied or endorsed by TradingView. Read more in the Terms of Use.
✅ Get Free Signals! Join Our Telegram Channel Here: t.me/TheCryptoNuclear
✅ Twitter: twitter.com/crypto_nuclear
✅ Join Bybit : partner.bybit.com/b/nuclearvip
✅ Benefits : Lifetime Trading Fee Discount -50%
✅ Twitter: twitter.com/crypto_nuclear
✅ Join Bybit : partner.bybit.com/b/nuclearvip
✅ Benefits : Lifetime Trading Fee Discount -50%
Disclaimer
The information and publications are not meant to be, and do not constitute, financial, investment, trading, or other types of advice or recommendations supplied or endorsed by TradingView. Read more in the Terms of Use.