
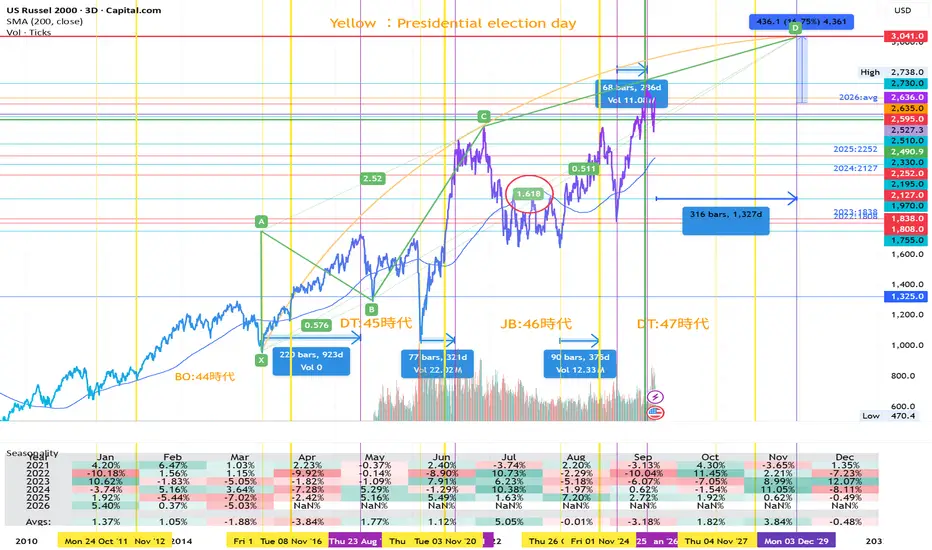
This is a continuation of the previous chart analysis. It’s a long journey—almost like a field trip.
The Russell 2000 Index is currently at a year-to-date level of +6.53%.
Now then, according to geometric delta analysis, with a remaining time of approximately 1,327 days, the level along the trajectory defined by the golden ratio (1.618) is 3,041 points.
This reflects the typical relationship between U.S. presidential election timing and equity market behavior. Given that the Russell 2000 consists of small- and mid-cap stocks, it tends to enter an upward trend roughly one year prior to a U.S. presidential election.
Yellow :Presidential election day
The Russell 2000 Index is currently at a year-to-date level of +6.53%.
Now then, according to geometric delta analysis, with a remaining time of approximately 1,327 days, the level along the trajectory defined by the golden ratio (1.618) is 3,041 points.
This reflects the typical relationship between U.S. presidential election timing and equity market behavior. Given that the Russell 2000 consists of small- and mid-cap stocks, it tends to enter an upward trend roughly one year prior to a U.S. presidential election.
Yellow :Presidential election day

Related publications
Disclaimer
The information and publications are not meant to be, and do not constitute, financial, investment, trading, or other types of advice or recommendations supplied or endorsed by TradingView. Read more in the Terms of Use.
Related publications
Disclaimer
The information and publications are not meant to be, and do not constitute, financial, investment, trading, or other types of advice or recommendations supplied or endorsed by TradingView. Read more in the Terms of Use.