
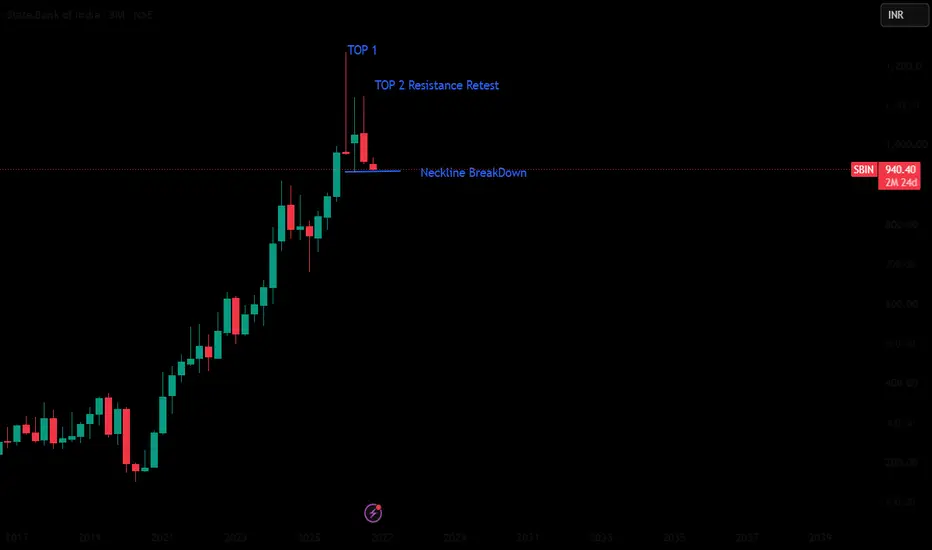
SBI’s 3-month chart is showing a potential Double Top following a strong upward trend.
The first peak was followed by a pullback. Price then rallied toward the previous resistance zone, forming a second, slightly lower peak and showing rejection near that area.
The reaction low between these two peaks forms the neckline, marked on the chart. This support is the key level to watch as price tests the potential breakdown.
A completed 3-month candle closing below the neckline would confirm the pattern under a candle-close confirmation approach. Until then, the breakdown remains provisional.
If confirmed, the next development to watch would be downside follow-through, or a bounce back toward the neckline. Rejection on that retest would support the bearish interpretation; a sustained recovery above the neckline would weaken it.
This chart study explains the pattern and its confirmation conditions for educational purposes.
The first peak was followed by a pullback. Price then rallied toward the previous resistance zone, forming a second, slightly lower peak and showing rejection near that area.
The reaction low between these two peaks forms the neckline, marked on the chart. This support is the key level to watch as price tests the potential breakdown.
A completed 3-month candle closing below the neckline would confirm the pattern under a candle-close confirmation approach. Until then, the breakdown remains provisional.
If confirmed, the next development to watch would be downside follow-through, or a bounce back toward the neckline. Rejection on that retest would support the bearish interpretation; a sustained recovery above the neckline would weaken it.
This chart study explains the pattern and its confirmation conditions for educational purposes.

Disclaimer
The information and publications are not meant to be, and do not constitute, financial, investment, trading, or other types of advice or recommendations supplied or endorsed by TradingView. Read more in the Terms of Use.
Disclaimer
The information and publications are not meant to be, and do not constitute, financial, investment, trading, or other types of advice or recommendations supplied or endorsed by TradingView. Read more in the Terms of Use.