Som Distilleries – Weekly Analysis Up to 32.32% UPSIDE Potential
 SDBL
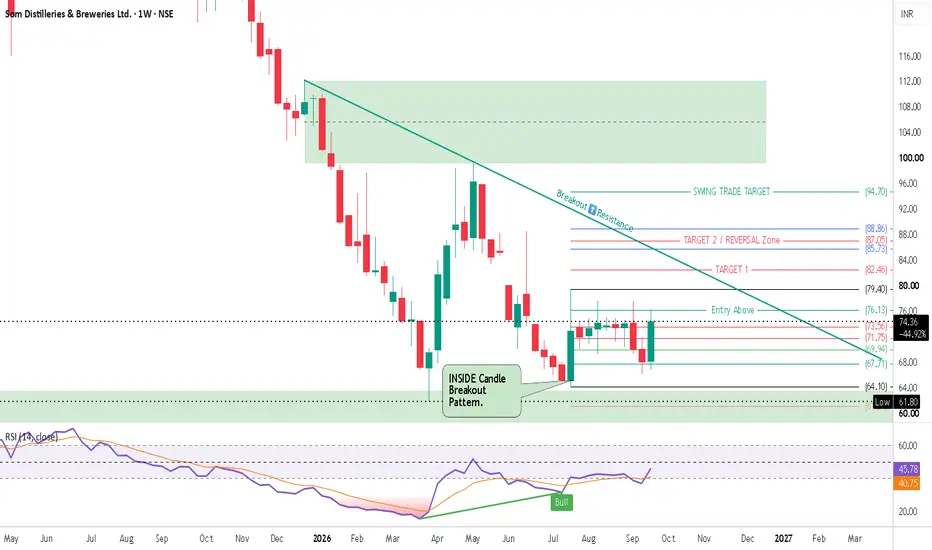
Som Distilleries & Breweries Ltd. is setting up a high-reward structural recovery setup on the weekly chart after executing a multi-month accumulation base above ₹61.80. The chart features an **INSIDE Candle Breakout Pattern** following a major structural low at ₹61.80, supported by a prominent **RSI Bullish Divergence (Bull)** on the weekly 14-period RSI indicator. Currently trading at ₹74.36 (+9.26%), price is coiling directly beneath a long-term **Breakout / Resistance** diagonal trendline and the primary **Entry Above** trigger at ₹76.13.
🔹 PATTERN: INSIDE CANDLE BREAKOUT & RSI BULLISH DIVERGENCE
• Inside Candle Breakout Pattern: Price formed a multi-week consolidation range inside the span of a large directional weekly candle, establishing a clear volatility compression base.
• RSI Bullish Divergence (Bull): Higher bottoms printed on the weekly RSI indicator while price tested lower structural support levels, confirming strong underlying momentum accumulation.
• Breakout / Resistance Trendline: A long-term descending green resistance line originating from previous swing highs down across overhead targets.
• Major Support Floor: A highlighted green horizontal demand zone between ₹61.80 and ₹64.10 (Structural Low at ₹61.80).
• Entry Trigger: Key weekly resistance and horizontal trigger level at Entry Above ₹76.13.
🟢 UPSIDE SCENARIO – BULLISH BREAKOUT
• Primary Entry Level (BUY Entry): ₹76.13 (Entry Above)
• Secondary Breakout Trigger: ₹79.40 (+4.29% move from BUY entry)
• Confirmation Required: Weekly candle close above ₹76.13 – ₹79.40
• TARGET 1: ₹82.46 (+8.31% move from BUY entry)
• TARGET 2 / REVERSAL Zone: ₹85.73 / ₹87.05 / ₹88.86 (+12.61% to +16.72% move from BUY entry)
• SWING TRADE TARGET: ₹94.70 (+24.39% move from ₹76.13 BUY entry / +19.27% from ₹79.40 breakout / +32.32% relative to current price from base low)
🔴 DOWNSIDE SCENARIO – BEARISH BREAKDOWN
• Weakening Level: Rejection near ₹76.13 / ₹79.40 followed by loss of immediate support at ₹71.75
• Breakdown Level: Below ₹67.71 into lower demand
• Important Support Levels: ₹73.56, ₹71.75, ₹69.94, ₹67.71, ₹64.10, and ₹61.80 (Structural Low)
• Invalidation / Stop Loss (SL): Weekly candle close below ₹67.71 (-11.06% SL from BUY entry) or structural base low at ₹61.80 (-18.82% SL).
🔹 MY BREAKOUT & EXIT RULE
If price crosses above a key resistance level (such as ₹76.13, ₹79.40, or ₹82.46) and makes a High above that level, but closes below that same level, I consider it a failed breakout/rejection and the BUYER NEEDS TO EXIT THE TRADE.
High above level + Close below level = Failed breakout → EXIT BUY TRADE.
🎯 MY TRADE ROADMAP
Bullish Breakout Path:
₹76.13 Entry Above (BUY Entry)
↓
₹79.40 Secondary Breakout Confirmation (+4.29% from BUY Entry)
↓
₹82.46 TARGET 1 (+8.31% from BUY Entry)
↓
₹85.73 / ₹87.05 / ₹88.86 TARGET 2 / REVERSAL Zone (+12.61% to +16.72% from BUY Entry)
↓
₹94.70 SWING TRADE TARGET (+24.39% from BUY Entry)
Bearish Breakdown Path:
Rejection near ₹76.13 / ₹79.40 Resistance
↓
₹73.56 / ₹71.75 Immediate Support Band
↓
₹69.94 Intermediate Support
↓
₹67.71 – ₹61.80 Major Support Base (Stop Loss -11.06% to -18.82%)
🔑 MY VIEW
The preferred setup favors a strong weekly bullish recovery, provided price holds support above ₹71.75 and delivers a confirmed weekly close above the ₹76.13 BUY entry trigger. The combination of an Inside Candle Breakout structure and weekly RSI bullish divergence points to a strong base accumulation.
The bullish thesis accelerates once price trades and closes above ₹76.13 (BUY Entry) and breaks through the diagonal resistance trendline at ₹79.40, opening the rally toward ₹82.46 (+8.31% from BUY Entry), the ₹85.73 – ₹88.86 reversal zone (+12.61% to +16.72%), and ultimately the SWING TRADE TARGET at ₹94.70 (+24.39% from BUY Entry). The setup is invalidated if price gets rejected at resistance and breaks down with a weekly close below ₹67.71 (-11.06% SL). A breakout confirmation requires a solid weekly candle close above trigger levels, strictly following the candle-close exit rule if a rejection occurs.
---
This is technical analysis based on chart structure, price levels, and visual patterns shown above. It is not financial advice. Market conditions can change and actual price movement may differ from projected levels.

Disclaimer
The information and publications are not meant to be, and do not constitute, financial, investment, trading, or other types of advice or recommendations supplied or endorsed by TradingView. Read more in the Terms of Use.
Disclaimer
The information and publications are not meant to be, and do not constitute, financial, investment, trading, or other types of advice or recommendations supplied or endorsed by TradingView. Read more in the Terms of Use.