
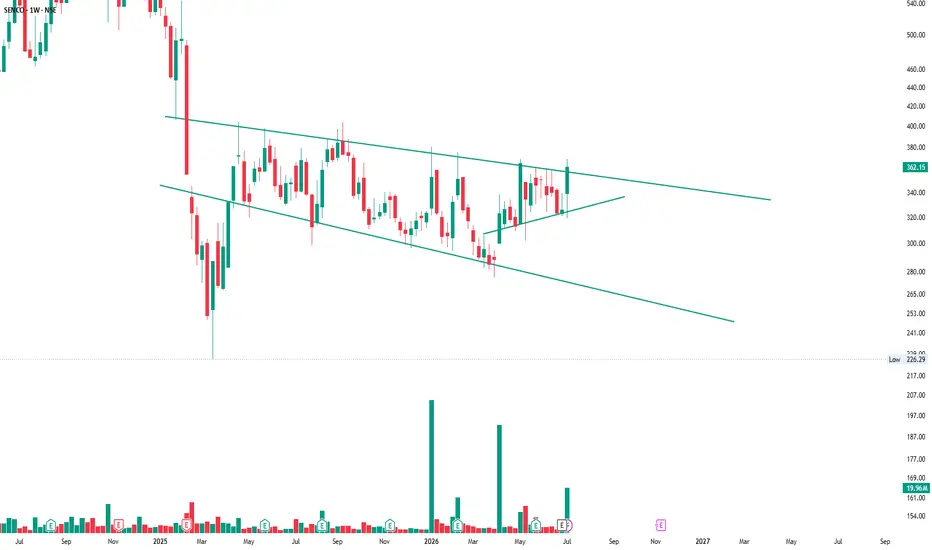
SENCO has finally broken above its long-term descending trendline after spending several months in consolidation.
What caught my attention wasn't just the breakout candle—it was the series of higher lows, showing that buyers were gradually taking control. When price compresses against a major resistance with improving market structure, the probability of a breakout increases.
A sustained move above the trendline can strengthen the bullish structure, while failure to hold above the breakout level may lead to a retest.
Many traders think drawing trendlines is enough. In reality, the edge comes from understanding price action, market structure, and the context behind the breakout.
Study this chart carefully. Every breakout has a story, and price usually leaves clues before making the move.
What caught my attention wasn't just the breakout candle—it was the series of higher lows, showing that buyers were gradually taking control. When price compresses against a major resistance with improving market structure, the probability of a breakout increases.
A sustained move above the trendline can strengthen the bullish structure, while failure to hold above the breakout level may lead to a retest.
Many traders think drawing trendlines is enough. In reality, the edge comes from understanding price action, market structure, and the context behind the breakout.
Study this chart carefully. Every breakout has a story, and price usually leaves clues before making the move.

ChartsWithVenu
Disclaimer
The information and publications are not meant to be, and do not constitute, financial, investment, trading, or other types of advice or recommendations supplied or endorsed by TradingView. Read more in the Terms of Use.
ChartsWithVenu
Disclaimer
The information and publications are not meant to be, and do not constitute, financial, investment, trading, or other types of advice or recommendations supplied or endorsed by TradingView. Read more in the Terms of Use.