
🚀 | Expiry Special Educational Guide 📚
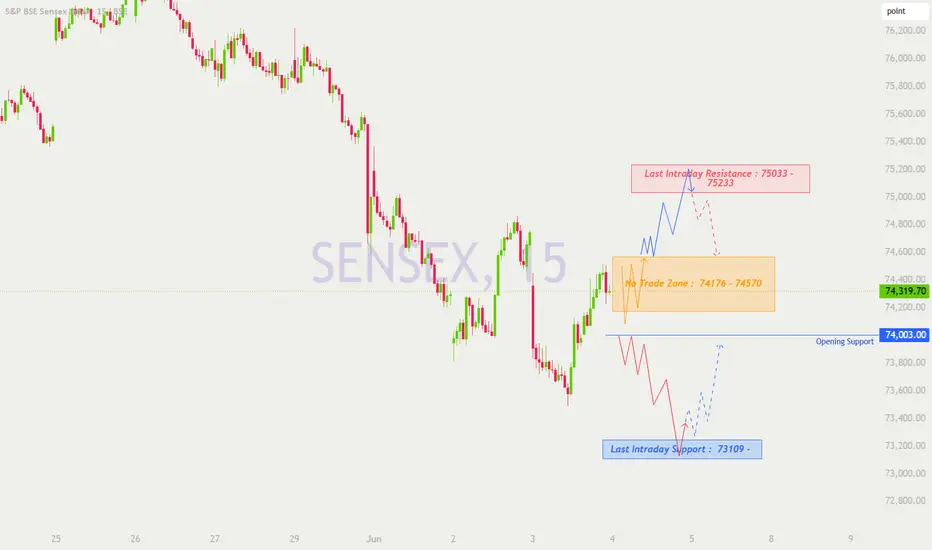
Hello Traders! 🙋♂️ Welcome back to our professional execution framework. In this post, we analyze the structural price action setup for BSE SENSEX ahead of the trading session on 04-Jun-2026. Referring explicitly to the 15-minute timeframe chart (reference: image_969afc.png), SENSEX closed at 74,319.70, settling right in the heart of a crucial consolidation band.
Since we are dealing with high-gamma movements, let's map out objective technical paths for all three opening scenarios so you can trade purely on confirmation rather than anticipation! 🧠📈
🟢 Scenario 1: Gap Up Opening (300+ Points)
If global cues spark a major gap up of 300+ points, SENSEX will open above 74,620, immediately shifting above the upper ceiling of our highlighted consolidation band.
Educational Plan & Action on Levels:
🔹 The Retest Logic (Solid Blue Path): A large gap up instantly traps short sellers from the previous sessions and leaves overnight call buyers sitting on rich profits. To manage risk, do not buy the first 15-minute candle. Instead, wait for a healthy pullback to test the boundary of the No Trade Zone at 74,570.
🔹 The Execution Trigger: If the index retraces to 74,570, creates a structural higher-low, and prints a bullish rejection candle (like a Hammer or a strong green closing candle), it confirms that old resistance has officially flipped to new support. A long position can be planned here.
🔹 Targets & Overhead Supply (Dotted Red Path): The primary target for this move is the Last Intraday Resistance band of 75,033 - 75,233. Be highly cautious near 75,233. If you see immediate upper-wick rejections, expect institutional sellers to dump inventory, driving a sharp counter-rally back down to the 74,600 area.
🟡 Scenario 2: Flat Opening (Near 74,319)
A flat opening means SENSEX begins its day within the immediate boundary of yesterday's close, putting us squarely inside the highlighted orange box.
Educational Plan & Action on Levels:
🔸 The Chop Trap (Orange Zigzag Path): The zone between 74,176 and 74,570 is strictly labeled as a No Trade Zone. Within these boundaries, bulls and bears are locked in a sideways tug-of-war. For retail option buyers, this zone is quicksand—especially with rapid premium erosion.
🔸 Patience Pays: The professional strategy here is to keep your hands off the terminal and let the index expand the range.
🔸 Breakout/Breakdown Triggers: If the price clears 74,570 and sustains, execute the long plan outlined in Scenario 1. If the price slips below 74,176, it will immediately check the strength of the vital Opening Support line at 74,003.00. A definitive breakdown under 74,003 hands total intraday control over to the bears.
🔴 Scenario 3: Gap Down Opening (300+ Points)
A heavy 300+ point gap down will dump SENSEX below 74,020, forcing an immediate challenge to the major multi-day defensive lines.
Educational Plan & Action on Levels:
🔻 The Bearish Break (Solid Red Path): Opening below the 74,003.00 Opening Support line invalidates the recent short-term accumulation structure. If the market attempts to push up but repeatedly faces rejection at 74,003, it turns into a clean "sell-on-rising" setup.
🔻 Downside Target: This structural breakdown creates an open field for the bears, paving a direct downward trajectory toward the major Last Intraday Support at 73,109.
🔻 The Institutional Bounce Zone (Dotted Blue Path): Do not run short trades aggressively straight into the 73,109 structural demand zone! This is a multi-day major floor. Look out for a failure to make new lows, double-bottom patterns (W-pattern), or sudden high-volume buying climaxes. If confirmed, a high-reward reversal swing trade can be planned to target a massive short-covering bounce back toward 74,000.
🛡️ Risk Management Protocol for Options Trading
Navigating premium structures requires institutional discipline:
🔹 Strict Capital Exposure: Never risk more than 1% to 2% of your total liquid trading capital on any single options setup.
🔹 The Theta Quick-Sand: When trading inside the 74,176 - 74,570 zone, premium decay will destroy your account equity while the spot index moves completely sideways. Sit on your hands and wait for structural expansion.
🔹 Index-Driven Invalidation: Never base your stop loss on option premium charts. Premium prices spike and warp due to Implied Volatility (IV) changes. Always place your hard stops based on the actual SENSEX spot index chart levels.
🔹 Strike Selection Rules: Avoid out-of-the-money (OTM) lottery contracts. Stick rigidly to At-The-Money (ATM) or slightly In-The-Money (ITM) options to ensure clean delta tracking and highly reliable liquidity.
📝 Summary & Conclusion
To summarize the trading matrix for 04-Jun-2026: The market structure tells us that 74,176 - 74,570 is a dense congestion zone where capital goes to burn. Trading comfortably north of 74,570 unlocks an upside highway toward 75,033 - 75,233. On the downside, a clean structural failure under 74,003.00 shifts total dominance to the bears for a deeper flush toward 73,109, where a sharp long-term swing reversal must be monitored. Let the market tips reveal themselves via candle closes, react to the levels objectively, and preserve your capital ruthlessly! 🎯🛡️
Disclaimer: I am not a sebi registered analyst. This detailed roadmap, chart visual study, and price action log are curated strictly for educational illustration and mock simulation practice. Please perform your own exhaustive due diligence and consult your certified financial planner before risking real currency in the live markets.
Hello Traders! 🙋♂️ Welcome back to our professional execution framework. In this post, we analyze the structural price action setup for BSE SENSEX ahead of the trading session on 04-Jun-2026. Referring explicitly to the 15-minute timeframe chart (reference: image_969afc.png), SENSEX closed at 74,319.70, settling right in the heart of a crucial consolidation band.
Since we are dealing with high-gamma movements, let's map out objective technical paths for all three opening scenarios so you can trade purely on confirmation rather than anticipation! 🧠📈
🟢 Scenario 1: Gap Up Opening (300+ Points)
If global cues spark a major gap up of 300+ points, SENSEX will open above 74,620, immediately shifting above the upper ceiling of our highlighted consolidation band.
Educational Plan & Action on Levels:
🔹 The Retest Logic (Solid Blue Path): A large gap up instantly traps short sellers from the previous sessions and leaves overnight call buyers sitting on rich profits. To manage risk, do not buy the first 15-minute candle. Instead, wait for a healthy pullback to test the boundary of the No Trade Zone at 74,570.
🔹 The Execution Trigger: If the index retraces to 74,570, creates a structural higher-low, and prints a bullish rejection candle (like a Hammer or a strong green closing candle), it confirms that old resistance has officially flipped to new support. A long position can be planned here.
🔹 Targets & Overhead Supply (Dotted Red Path): The primary target for this move is the Last Intraday Resistance band of 75,033 - 75,233. Be highly cautious near 75,233. If you see immediate upper-wick rejections, expect institutional sellers to dump inventory, driving a sharp counter-rally back down to the 74,600 area.
🟡 Scenario 2: Flat Opening (Near 74,319)
A flat opening means SENSEX begins its day within the immediate boundary of yesterday's close, putting us squarely inside the highlighted orange box.
Educational Plan & Action on Levels:
🔸 The Chop Trap (Orange Zigzag Path): The zone between 74,176 and 74,570 is strictly labeled as a No Trade Zone. Within these boundaries, bulls and bears are locked in a sideways tug-of-war. For retail option buyers, this zone is quicksand—especially with rapid premium erosion.
🔸 Patience Pays: The professional strategy here is to keep your hands off the terminal and let the index expand the range.
🔸 Breakout/Breakdown Triggers: If the price clears 74,570 and sustains, execute the long plan outlined in Scenario 1. If the price slips below 74,176, it will immediately check the strength of the vital Opening Support line at 74,003.00. A definitive breakdown under 74,003 hands total intraday control over to the bears.
🔴 Scenario 3: Gap Down Opening (300+ Points)
A heavy 300+ point gap down will dump SENSEX below 74,020, forcing an immediate challenge to the major multi-day defensive lines.
Educational Plan & Action on Levels:
🔻 The Bearish Break (Solid Red Path): Opening below the 74,003.00 Opening Support line invalidates the recent short-term accumulation structure. If the market attempts to push up but repeatedly faces rejection at 74,003, it turns into a clean "sell-on-rising" setup.
🔻 Downside Target: This structural breakdown creates an open field for the bears, paving a direct downward trajectory toward the major Last Intraday Support at 73,109.
🔻 The Institutional Bounce Zone (Dotted Blue Path): Do not run short trades aggressively straight into the 73,109 structural demand zone! This is a multi-day major floor. Look out for a failure to make new lows, double-bottom patterns (W-pattern), or sudden high-volume buying climaxes. If confirmed, a high-reward reversal swing trade can be planned to target a massive short-covering bounce back toward 74,000.
🛡️ Risk Management Protocol for Options Trading
Navigating premium structures requires institutional discipline:
🔹 Strict Capital Exposure: Never risk more than 1% to 2% of your total liquid trading capital on any single options setup.
🔹 The Theta Quick-Sand: When trading inside the 74,176 - 74,570 zone, premium decay will destroy your account equity while the spot index moves completely sideways. Sit on your hands and wait for structural expansion.
🔹 Index-Driven Invalidation: Never base your stop loss on option premium charts. Premium prices spike and warp due to Implied Volatility (IV) changes. Always place your hard stops based on the actual SENSEX spot index chart levels.
🔹 Strike Selection Rules: Avoid out-of-the-money (OTM) lottery contracts. Stick rigidly to At-The-Money (ATM) or slightly In-The-Money (ITM) options to ensure clean delta tracking and highly reliable liquidity.
📝 Summary & Conclusion
To summarize the trading matrix for 04-Jun-2026: The market structure tells us that 74,176 - 74,570 is a dense congestion zone where capital goes to burn. Trading comfortably north of 74,570 unlocks an upside highway toward 75,033 - 75,233. On the downside, a clean structural failure under 74,003.00 shifts total dominance to the bears for a deeper flush toward 73,109, where a sharp long-term swing reversal must be monitored. Let the market tips reveal themselves via candle closes, react to the levels objectively, and preserve your capital ruthlessly! 🎯🛡️
Disclaimer: I am not a sebi registered analyst. This detailed roadmap, chart visual study, and price action log are curated strictly for educational illustration and mock simulation practice. Please perform your own exhaustive due diligence and consult your certified financial planner before risking real currency in the live markets.

Disclaimer
The information and publications are not meant to be, and do not constitute, financial, investment, trading, or other types of advice or recommendations supplied or endorsed by TradingView. Read more in the Terms of Use.
Disclaimer
The information and publications are not meant to be, and do not constitute, financial, investment, trading, or other types of advice or recommendations supplied or endorsed by TradingView. Read more in the Terms of Use.