
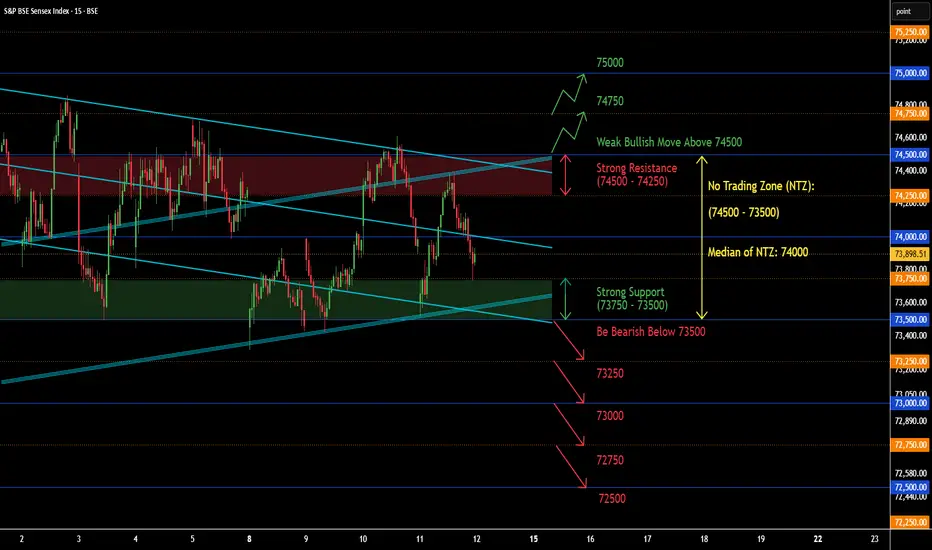
Probable Price Structure Analysis of SENSEX for the 12th of June, 2026. The day is Friday.
(1) Bullish Scenario:
Firstly, the price needs to sustain above the level of 74500. In the present scenario, doubt every upmove unless there is a breakout above the level of 74500. If the price forms a higher-highs and lower-lows structure above the level of 74500, then a weak bullish setup would emerge. The probable weak bullish targets above the level of 74500 are - 74750 and 75000.
(2) Bearish Scenario:
Firstly, the price needs to decisively break down below the level of 73500. If the price sustains below the level of 73500, then the probable bearish targets would be - 73250 and 73000. The level of 73000 would be strong support. Next, if the price again breaks down below the level of 73000, then the next probable bearish targets would be 72750 and 72500.
(3) No Trading Zone (NTZ): (74500 - 73500).
Here, the median of the NTZ is 74000. In the present scenario, the price is badly trapped in the NTZ. Here, the strong resistance zone is (74500 - 74250), and the strong support zone is (73750 - 73500). For smooth trend trading, the price needs to either break out or break down from the NTZ.
(5) Event:
There is no high-impact event this week. There are also no holidays this week. However, it is Friday, the last day of the week. Under the geopolitical tension, traders might remain bearish. Additionally, traders will avoid taking weekend risk by being bullish.
(6) Establish intraday bias with respect to the opening price. If the price sustains above the opening price, then don't think of shorting. Look for bullish trades only. On the contrary, if the price sustains below the opening price, then don't think of going long. Look for bearish trades in that case.
Top-Down Analysis:
(1) Monthly TF:
The candles are RED. The lower-lows and lower-highs structure is intact. The view is bearish.
(2) Weekly TF:
The lower-lows and lower-highs structure is intact. This week's candle looks like a green gravestone doji. It is a sign of indecision. The view is bearish.
(3) Daily TF:
The lower-lows and lower-highs structure is intact. The price is range-bound in the zone (74500 - 73500). Level 73421.61 is also crucial as it is the weekly opening. Don't think of bullish trades unless price sustains above the level 74500. The view is bearish.
(4) 30-minute TF:
The lower-lows and lower-highs structure is intact. The price is range-bound in the zone (74500 - 73500). Be bullish above 74500. Be bearish below 73500. Avoid trading in the range (74500 - 73500). The view is indecision to bearish.
NOTE:
(i) All the analyses would fail in the case of a major gap up, gap down, or price structure anomaly. Thus, practice PRAGMATISM in the live session.
(ii) Trade only if there is a set-up. Remember, not trading is an extension of the trading activity.
(iii) Mark your points. Trade your points. Price is GOD. Anything can happen in the markets. Thus, trade what you see, not what you believe.
(iv) Always PRACTICE RISK MANAGEMENT. Always PROTECT YOUR CAPITAL. Be RESPONSIBLE.
(v) Be Strategic. Be Courageous. Be Patient. Be Wise.
(vi) Every day is a new day. Thus, do not carry the baggage of past successes or failures. Leave the gardens of winning and losing. Establish yourself in equanimity. Always think from a new perspective.
(vii) Let the joy of trading drive your effectiveness, not greed or fear. Believe in Possibilities.
Happy Trading!
(1) Bullish Scenario:
Firstly, the price needs to sustain above the level of 74500. In the present scenario, doubt every upmove unless there is a breakout above the level of 74500. If the price forms a higher-highs and lower-lows structure above the level of 74500, then a weak bullish setup would emerge. The probable weak bullish targets above the level of 74500 are - 74750 and 75000.
(2) Bearish Scenario:
Firstly, the price needs to decisively break down below the level of 73500. If the price sustains below the level of 73500, then the probable bearish targets would be - 73250 and 73000. The level of 73000 would be strong support. Next, if the price again breaks down below the level of 73000, then the next probable bearish targets would be 72750 and 72500.
(3) No Trading Zone (NTZ): (74500 - 73500).
Here, the median of the NTZ is 74000. In the present scenario, the price is badly trapped in the NTZ. Here, the strong resistance zone is (74500 - 74250), and the strong support zone is (73750 - 73500). For smooth trend trading, the price needs to either break out or break down from the NTZ.
(5) Event:
There is no high-impact event this week. There are also no holidays this week. However, it is Friday, the last day of the week. Under the geopolitical tension, traders might remain bearish. Additionally, traders will avoid taking weekend risk by being bullish.
(6) Establish intraday bias with respect to the opening price. If the price sustains above the opening price, then don't think of shorting. Look for bullish trades only. On the contrary, if the price sustains below the opening price, then don't think of going long. Look for bearish trades in that case.
Top-Down Analysis:
(1) Monthly TF:
The candles are RED. The lower-lows and lower-highs structure is intact. The view is bearish.
(2) Weekly TF:
The lower-lows and lower-highs structure is intact. This week's candle looks like a green gravestone doji. It is a sign of indecision. The view is bearish.
(3) Daily TF:
The lower-lows and lower-highs structure is intact. The price is range-bound in the zone (74500 - 73500). Level 73421.61 is also crucial as it is the weekly opening. Don't think of bullish trades unless price sustains above the level 74500. The view is bearish.
(4) 30-minute TF:
The lower-lows and lower-highs structure is intact. The price is range-bound in the zone (74500 - 73500). Be bullish above 74500. Be bearish below 73500. Avoid trading in the range (74500 - 73500). The view is indecision to bearish.
NOTE:
(i) All the analyses would fail in the case of a major gap up, gap down, or price structure anomaly. Thus, practice PRAGMATISM in the live session.
(ii) Trade only if there is a set-up. Remember, not trading is an extension of the trading activity.
(iii) Mark your points. Trade your points. Price is GOD. Anything can happen in the markets. Thus, trade what you see, not what you believe.
(iv) Always PRACTICE RISK MANAGEMENT. Always PROTECT YOUR CAPITAL. Be RESPONSIBLE.
(v) Be Strategic. Be Courageous. Be Patient. Be Wise.
(vi) Every day is a new day. Thus, do not carry the baggage of past successes or failures. Leave the gardens of winning and losing. Establish yourself in equanimity. Always think from a new perspective.
(vii) Let the joy of trading drive your effectiveness, not greed or fear. Believe in Possibilities.
Happy Trading!

Disclaimer
The information and publications are not meant to be, and do not constitute, financial, investment, trading, or other types of advice or recommendations supplied or endorsed by TradingView. Read more in the Terms of Use.
Disclaimer
The information and publications are not meant to be, and do not constitute, financial, investment, trading, or other types of advice or recommendations supplied or endorsed by TradingView. Read more in the Terms of Use.