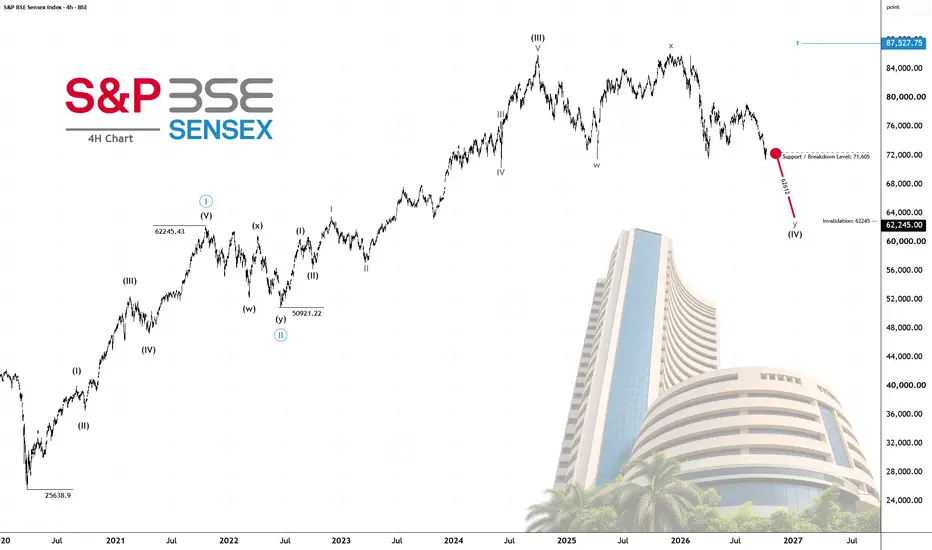
 SENSEX 4H: Wave (IV) as W-X-Y?
The S&P BSE Sensex 4-hour chart's ongoing decline can be interpreted as part of the larger Wave (IV) correction, currently developing in a W-X-Y structure.
📈 Short-term scenario:
71,605 is the immediate support level I am watching. If Sensex breaks 71,605 and continues closing below this level, the current Wave (Y) could potentially extend toward: 67,648 → 65,582 → 62,612
These are projected levels for the possible corrective path.
📉 Long-term structure:
The larger bullish Elliott Wave count remains the working interpretation while its relevant structural rules remain satisfied. If Wave (IV) eventually completes, the next development to watch would be the internal Wave (V) and whether the larger Wave ((III)) can continue higher.
👉 Key Levels:
🔴 Immediate support: 71,605
📉 Possible Wave (Y) levels: 67,648 / 65,582 / 62,612
🔵 Larger Wave ((III)) reference: 87,527 / 110,150+
⚠️ Invalidation: 62,245
Which path do you see for Sensex from here? Share your view below.

Related publications
Disclaimer
The information and publications are not meant to be, and do not constitute, financial, investment, trading, or other types of advice or recommendations supplied or endorsed by TradingView. Read more in the Terms of Use.
Related publications
Disclaimer
The information and publications are not meant to be, and do not constitute, financial, investment, trading, or other types of advice or recommendations supplied or endorsed by TradingView. Read more in the Terms of Use.