
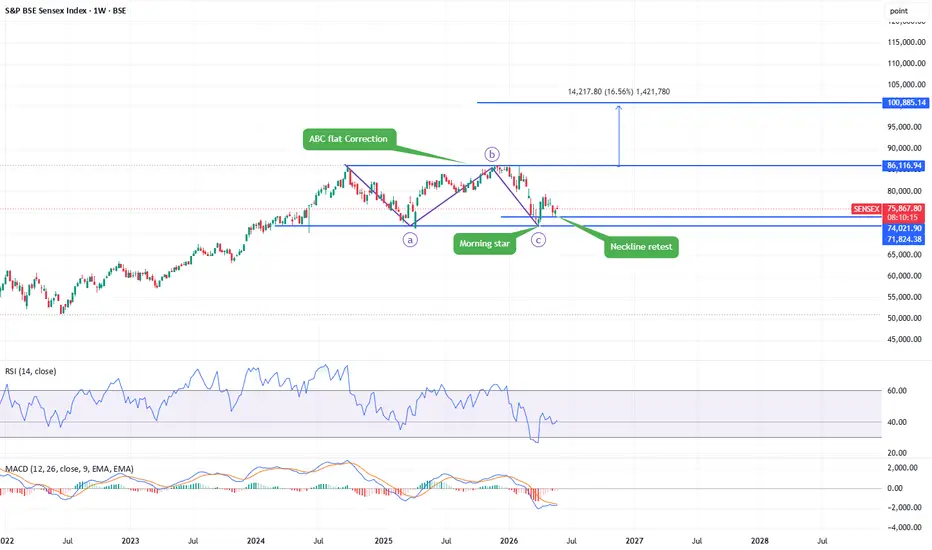
SENSEX Weekly Chart Analysis
Chart Structure Overview
Current Price: 75,867.80
Timeframe: Weekly (W) chart on BSE
Date: May 29, 2026
Elliott Wave / Pattern Analysis
ABC Flat Correction
The analyst has identified a classic ABC Flat Correction pattern:
The C wave appears to have bottomed near the 71,824 support level
A Morning Star candlestick pattern formed at the C-wave low — a strong bullish reversal signal
Price is now doing a Neckline Retest after bouncing — this is the critical make-or-break zone (~74,000–75,800)
Key Price Levels
Level Significance100,885 Major target / projected breakout level (+16.44% from resistance) 86,116 Strong resistance / neckline of the flat correction
75,867 Current price 74,021 Immediate support
71,824 Strong base support / C-wave bottom
Trading & Investment Opportunities
🟢 Bullish Case (Primary Scenario)
If the neckline retest holds around 74,000–76,000:
Entry Zone: 74,000–76,500 (current area)
Stop Loss: Below 71,500 (below C-wave low)
Target 1: 86,116 (resistance/neckline)
Target 2: 1,00,885 (long-term projected target)
🔴 Bearish / Caution Case
If price fails the neckline retest and closes below 74,000:
Could signal the ABC correction isn't complete
Next support: 68,000–70,000 range
Wait for price to stabilize before re-entering

Related publications
Disclaimer
The information and publications are not meant to be, and do not constitute, financial, investment, trading, or other types of advice or recommendations supplied or endorsed by TradingView. Read more in the Terms of Use.
Related publications
Disclaimer
The information and publications are not meant to be, and do not constitute, financial, investment, trading, or other types of advice or recommendations supplied or endorsed by TradingView. Read more in the Terms of Use.