
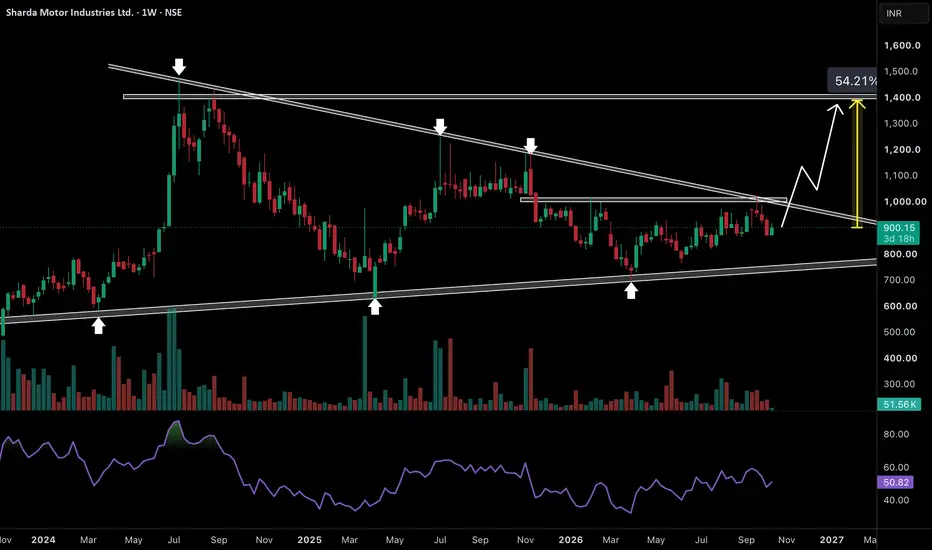
Sharda Motor is developing a very interesting multiyear symmetrical triangle pattern on the weekly chart and the stock is now approaching a crucial breakout stage. Since July 2024 every major recovery has faced rejection near the descending resistance trendline while buyers have continued defending the rising support trendline. This has gradually created a compression structure where selling pressure from the top is meeting accumulation from the bottom. What makes this setup interesting is that despite multiple corrections the stock has continued respecting its long-term support. The March 2026 reversal near 700 was particularly important because buyers stepped in aggressively and prevented another major decline. Since then price has been consolidating around 800–1000 while the descending resistance continues to move lower. This suggests that a decisive move could be approaching after more than two years of consolidation.
Now the most important area is 950–1020 where the descending trendline and horizontal resistance are coming together. A strong weekly breakout above this zone with improving volume could finally end the sequence of lower highs and trigger a major shift in momentum. Traders who have repeatedly sold near this resistance may get trapped once price starts sustaining above it. The first upside opportunity could emerge around 1100–1200 followed by the major historical resistance near 1400. From the current price around 900 this represents a potential 54% upside if the full bullish structure plays out. The RSI is currently near 51 which means momentum has not yet fully expanded and a confirmed breakout could bring fresh strength. A successful retest of 1000 as support would make the setup even more convincing. The stock has spent years building this structure and once the upper trendline breaks the next rally could be much faster than the consolidation that created it.
Now the most important area is 950–1020 where the descending trendline and horizontal resistance are coming together. A strong weekly breakout above this zone with improving volume could finally end the sequence of lower highs and trigger a major shift in momentum. Traders who have repeatedly sold near this resistance may get trapped once price starts sustaining above it. The first upside opportunity could emerge around 1100–1200 followed by the major historical resistance near 1400. From the current price around 900 this represents a potential 54% upside if the full bullish structure plays out. The RSI is currently near 51 which means momentum has not yet fully expanded and a confirmed breakout could bring fresh strength. A successful retest of 1000 as support would make the setup even more convincing. The stock has spent years building this structure and once the upper trendline breaks the next rally could be much faster than the consolidation that created it.

📌 Join Trading Community 👇
Telegram : 👉telegram.me/chartifyy
Instagram: 👉 instagram.com/chartifyig?igsi=Y2ZiODZtczZ2aDA=&utm_source=qr
Telegram : 👉telegram.me/chartifyy
Instagram: 👉 instagram.com/chartifyig?igsi=Y2ZiODZtczZ2aDA=&utm_source=qr
Disclaimer
The information and publications are not meant to be, and do not constitute, financial, investment, trading, or other types of advice or recommendations supplied or endorsed by TradingView. Read more in the Terms of Use.
📌 Join Trading Community 👇
Telegram : 👉telegram.me/chartifyy
Instagram: 👉 instagram.com/chartifyig?igsi=Y2ZiODZtczZ2aDA=&utm_source=qr
Telegram : 👉telegram.me/chartifyy
Instagram: 👉 instagram.com/chartifyig?igsi=Y2ZiODZtczZ2aDA=&utm_source=qr
Disclaimer
The information and publications are not meant to be, and do not constitute, financial, investment, trading, or other types of advice or recommendations supplied or endorsed by TradingView. Read more in the Terms of Use.