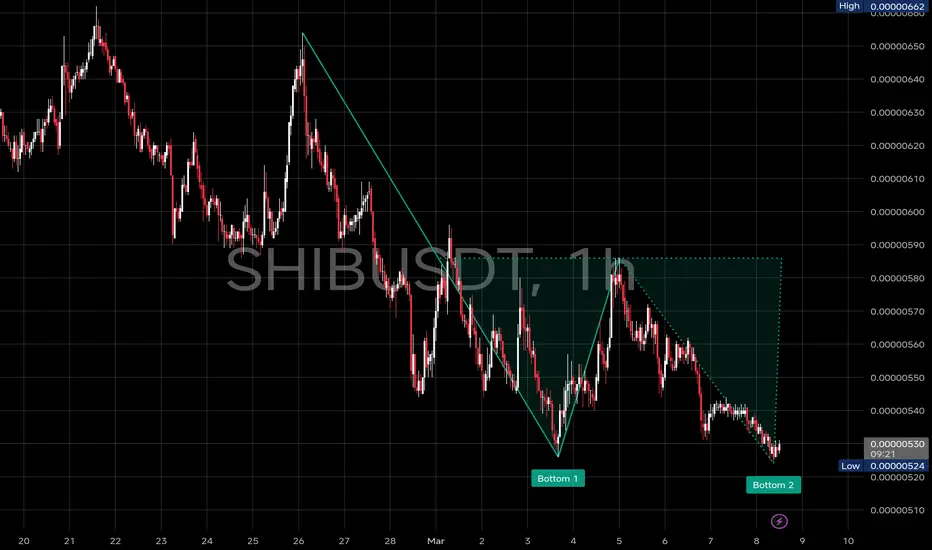
 SHIB is forming a double-bottom on the 4H chart, bouncing off the 0.00000524–0.00000530 support zone. This region previously acted as a strong reaction area, and buyers are again attempting to defend it after the recent downtrend.
The price has formed Bottom 1 and Bottom 2 near the same support level, indicating possible accumulation or a depletion of selling pressure. After the second bottom formed, #SHIB is starting to show a small reaction bounce.
If this double-bottom holds, the price might try to hit around 0.00000555–0.00000565, where there was some short-term supply before. A stronger push could extend toward 0.00000580–0.00000590, the upper reaction zone marked in the chart.
However, this structure still needs confirmation. If price fails to hold the 0.00000520 region, the support breaks and SHIB could extend lower toward 0.00000500 or new lows, as sellers would regain full control.
Key levels to watch
Support: 0.00000524–0.00000530
Bounce targets: 0.00000555 → 0.00000580
For now, this area is a reaction zone, and traders will watch whether buyers can build momentum from the double-bottom base.
➖➖➖➖➖
Follow Crypto Sat 🟨

Disclaimer
The information and publications are not meant to be, and do not constitute, financial, investment, trading, or other types of advice or recommendations supplied or endorsed by TradingView. Read more in the Terms of Use.
Disclaimer
The information and publications are not meant to be, and do not constitute, financial, investment, trading, or other types of advice or recommendations supplied or endorsed by TradingView. Read more in the Terms of Use.