
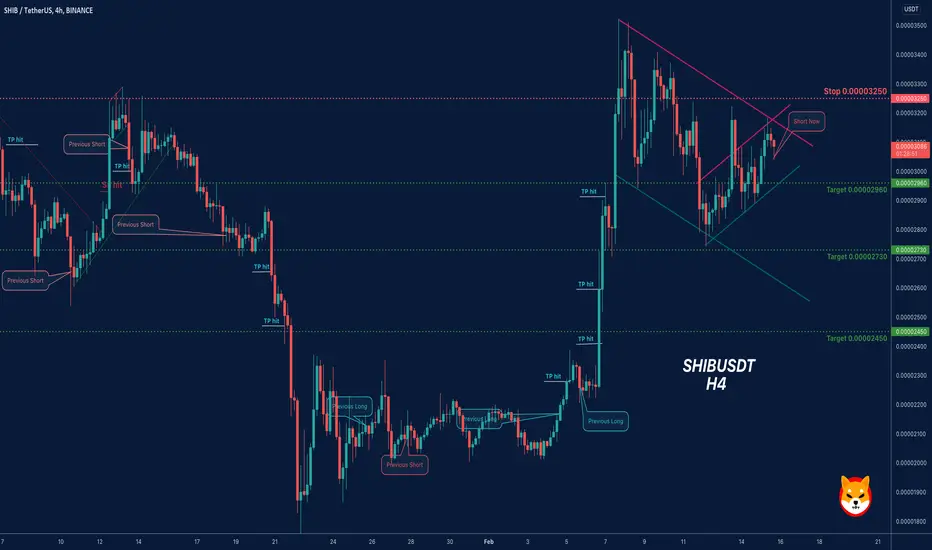
En el gráfico SHIBUSDT, el precio está dentro del techo del canal de la bandera, y se forma un pico en el marco de tiempo de 4 horas, y el precio tiene el potencial de moverse por debajo de la bandera, y podemos actuar a través de la siguiente configuración
📊 SHIBUSDT Shiba Inu
🔴Corto Ahora 0.00003070
🏹 Objetivo 1 0.00002960
🏹 Objetivo 2 0.00002730
🏹 Objetivo 3 0.00002450
🧯 Stop-loss 0.00003250
💸Capital : 2%
Si esta señal llega a SL, solo se permite perder %2 de su capital.
📊 SHIBUSDT Shiba Inu
🔴Corto Ahora 0.00003070
🏹 Objetivo 1 0.00002960
🏹 Objetivo 2 0.00002730
🏹 Objetivo 3 0.00002450
🧯 Stop-loss 0.00003250
💸Capital : 2%
Si esta señal llega a SL, solo se permite perder %2 de su capital.

Disclaimer
The information and publications are not meant to be, and do not constitute, financial, investment, trading, or other types of advice or recommendations supplied or endorsed by TradingView. Read more in the Terms of Use.
Disclaimer
The information and publications are not meant to be, and do not constitute, financial, investment, trading, or other types of advice or recommendations supplied or endorsed by TradingView. Read more in the Terms of Use.