
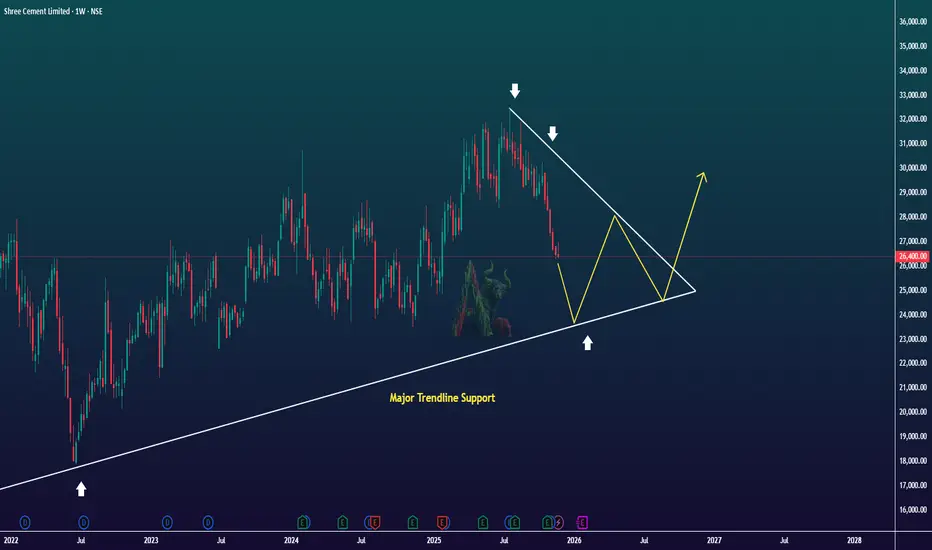
Price is approaching a broad trendline support while forming a descending triangle on the upper side. Weekly structure shows compression. We can expect a possible strong move ahead once it reaches the major support zone. As of now watch the trendline.
Break down = momentum shift in the downward direction
Bounce = continuation to the upside
Break down = momentum shift in the downward direction
Bounce = continuation to the upside
Trade active
Trade closed: target reached

Disclaimer
The information and publications are not meant to be, and do not constitute, financial, investment, trading, or other types of advice or recommendations supplied or endorsed by TradingView. Read more in the Terms of Use.
Disclaimer
The information and publications are not meant to be, and do not constitute, financial, investment, trading, or other types of advice or recommendations supplied or endorsed by TradingView. Read more in the Terms of Use.