
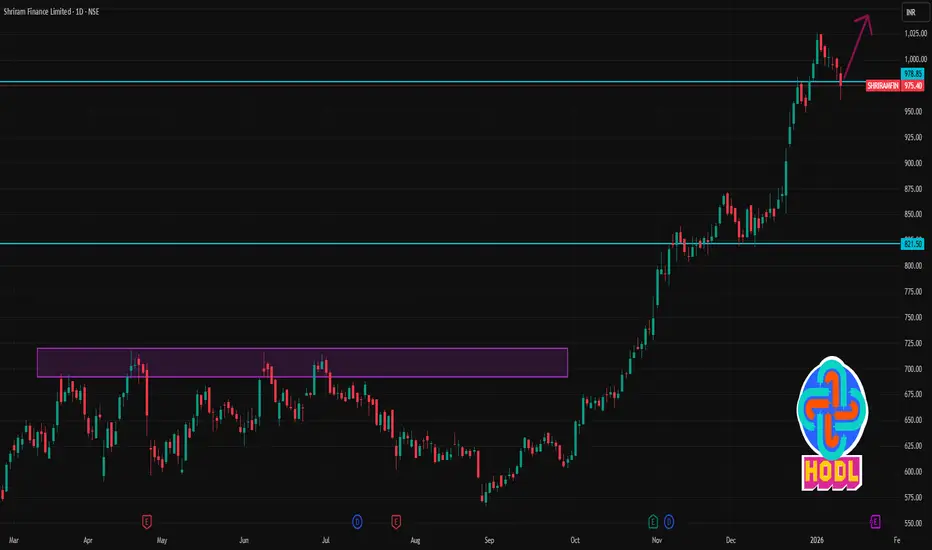
📈 Current Stock Price Snapshot
Latest Price: ~₹975–₹987 range (varies with live trading) — recent data shows around ₹975 – ₹987 on daily charts.
📊 Daily Pivot & Levels (1-Day Timeframe)
These are calculated from the previous trading session’s high/low/close and act as key intraday reference points:
🔹 Pivot Point (Central): ~₹976.50
📈 Resistance Levels:
R1: ~ ₹992–₹1,008
R2: ~ ₹1,008–₹1,024
R3: ~ ₹1,024+
📉 Support Levels:
S1: ~ ₹964–₹970
S2: ~ ₹959–₹960
S3: ~ ₹944–₹952
How to interpret:
Above Pivot (~₹976.50) → bullish bias for the day.
Below Pivot → neutral to bearish intraday mode.
Key breakout level: close above R1/R2 with volume can signal stronger upside.
Key breakdown level: close below S1/S2 increases short-term weakness risk.
🗓 Short-Term Price Range
Given recent volatility, expect intraday swings of ~₹15–₹30 from current levels (based on ATR and recent price range).
🔍 Summary — 1-Day Technical Levels
Level Price Zone Bias
R3 ~ ₹1,020+ Strong resistance area
R2 ~ ₹1,008–₹1,024 Secondary resistance
R1 ~ ₹992–₹1,008 First upside hurdle
Pivot ~ ₹976.5 Key intraday trend marker
S1 ~ ₹964–₹970 First downside support
S2 ~ ₹959–₹960 Secondary support
S3 ~ ₹944–₹952 Stronger support area
📌 Notes for Today
✔ Intraday bias turns bullish only if price sustains above the pivot and breaks R1 on volume.
✔ If price slides below S1/S2, the next cushion is around S3 — failure below that suggests deeper corrective moves.
✔ These levels adjust daily based on price action — use with real-time charts for validation.

Contact Knowledgehub for a detailed consultation: Dm on WhatsApp: [wa.link/a2o0kz]-
Phone No: [+91 93102 26243]-
Email: [tradingviewknowledgehub@gmail.com]---
-- Let’s achieve success together!
Phone No: [+91 93102 26243]-
Email: [tradingviewknowledgehub@gmail.com]---
-- Let’s achieve success together!
Related publications
Disclaimer
The information and publications are not meant to be, and do not constitute, financial, investment, trading, or other types of advice or recommendations supplied or endorsed by TradingView. Read more in the Terms of Use.