
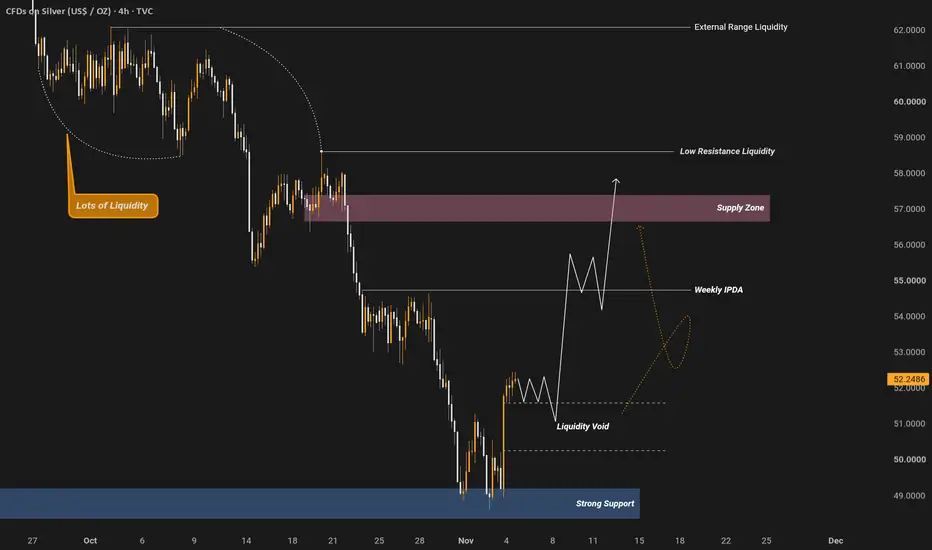
Welcome traders to this comprehensive institutional grade market analysis of XAGUSD on the 4 hour timeframe. In this detailed breakdown we will examine the current price action dynamics, liquidity pools, supply zones, liquidity voids, and potential market pathways shown on the chart. The primary objective of this analysis is to provide a complete and professional roadmap of how institutional order flow is driving silver prices without any unnecessary complexity.
Understanding External Range Liquidity and Market Context:
The chart highlights External Range Liquidity near the upper boundary of the recent macro structure. External range liquidity refers to significant swing highs and swing lows where stop losses and pending breakout orders rest in large numbers. When price approaches these outer boundaries, institutional participants often target that liquidity to fill large institutional orders before initiating major trend reversals or continuations. Recognizing these external pools helps traders anticipate primary market turning points.
Lots of Liquidity and Market Accumulation:
Further back on the chart, a specific area is marked as Lots of Liquidity, indicating a dense cluster of resting orders and previous consolidation. This accumulation zone shows where market participants piled into positions before an aggressive expansion took place. Institutional algorithms frequently revisit or draw inspiration from these areas to gauge market sentiment and manage large capital allocations.
Supply Zone and Institutional Rejection Levels:
Higher up on the chart, a prominent horizontal region is designated as the Supply Zone. A supply zone represents an area where institutional sellers previously stepped in with heavy volume, causing a sharp downward displacement in price. As silver experiences corrective pullbacks, this supply zone acts as a critical ceiling where fresh short positions can be evaluated or where existing bullish momentum may face strong resistance.
Liquidity Void and Price Fill Mechanics:
The chart also features an area marked as a Liquidity Void. A liquidity void represents a gap in order delivery where price moved so rapidly that very few transactions occurred. Financial markets naturally seek efficiency, meaning price has a high statistical tendency to return to these void areas to rebalance the order book before determining its next directional expansion.
Strong Support and Lower Range Boundaries:
At the lower end of the chart, a major horizontal floor is marked as Strong Support. This zone represents a significant demand block where buyers previously entered the market with strong volume, creating a robust price reaction. As the projected path on the chart indicates, price often tests these foundational levels to absorb remaining sell-side pressure before attempting a corrective recovery towards higher supply zones and low resistance liquidity.
Trade Execution and Risk Management Framework:
To trade this setup effectively, patience and strict adherence to risk management are required. Traders typically look for rejections from the supply zone or reactions around major support levels to execute high probability setups. Stop losses should be placed safely beyond structural invalidation points, and partial profits can be scaled out near intermediate targets while managing open risk responsibly.
Disclaimer:
This analysis is strictly for educational and informational purposes only and does not constitute financial or investment advice. Always manage your risk responsibly and conduct your own thorough analysis before executing any trades in the financial markets.
Understanding External Range Liquidity and Market Context:
The chart highlights External Range Liquidity near the upper boundary of the recent macro structure. External range liquidity refers to significant swing highs and swing lows where stop losses and pending breakout orders rest in large numbers. When price approaches these outer boundaries, institutional participants often target that liquidity to fill large institutional orders before initiating major trend reversals or continuations. Recognizing these external pools helps traders anticipate primary market turning points.
Lots of Liquidity and Market Accumulation:
Further back on the chart, a specific area is marked as Lots of Liquidity, indicating a dense cluster of resting orders and previous consolidation. This accumulation zone shows where market participants piled into positions before an aggressive expansion took place. Institutional algorithms frequently revisit or draw inspiration from these areas to gauge market sentiment and manage large capital allocations.
Supply Zone and Institutional Rejection Levels:
Higher up on the chart, a prominent horizontal region is designated as the Supply Zone. A supply zone represents an area where institutional sellers previously stepped in with heavy volume, causing a sharp downward displacement in price. As silver experiences corrective pullbacks, this supply zone acts as a critical ceiling where fresh short positions can be evaluated or where existing bullish momentum may face strong resistance.
Liquidity Void and Price Fill Mechanics:
The chart also features an area marked as a Liquidity Void. A liquidity void represents a gap in order delivery where price moved so rapidly that very few transactions occurred. Financial markets naturally seek efficiency, meaning price has a high statistical tendency to return to these void areas to rebalance the order book before determining its next directional expansion.
Strong Support and Lower Range Boundaries:
At the lower end of the chart, a major horizontal floor is marked as Strong Support. This zone represents a significant demand block where buyers previously entered the market with strong volume, creating a robust price reaction. As the projected path on the chart indicates, price often tests these foundational levels to absorb remaining sell-side pressure before attempting a corrective recovery towards higher supply zones and low resistance liquidity.
Trade Execution and Risk Management Framework:
To trade this setup effectively, patience and strict adherence to risk management are required. Traders typically look for rejections from the supply zone or reactions around major support levels to execute high probability setups. Stop losses should be placed safely beyond structural invalidation points, and partial profits can be scaled out near intermediate targets while managing open risk responsibly.
Disclaimer:
This analysis is strictly for educational and informational purposes only and does not constitute financial or investment advice. Always manage your risk responsibly and conduct your own thorough analysis before executing any trades in the financial markets.

Join My Free Telegram Signal
t.me/+K6J2uweHFzxiNDFk
Follow The Trend Not a Crowd
t.me/+K6J2uweHFzxiNDFk
Follow The Trend Not a Crowd
Disclaimer
The information and publications are not meant to be, and do not constitute, financial, investment, trading, or other types of advice or recommendations supplied or endorsed by TradingView. Read more in the Terms of Use.
Join My Free Telegram Signal
t.me/+K6J2uweHFzxiNDFk
Follow The Trend Not a Crowd
t.me/+K6J2uweHFzxiNDFk
Follow The Trend Not a Crowd
Disclaimer
The information and publications are not meant to be, and do not constitute, financial, investment, trading, or other types of advice or recommendations supplied or endorsed by TradingView. Read more in the Terms of Use.