
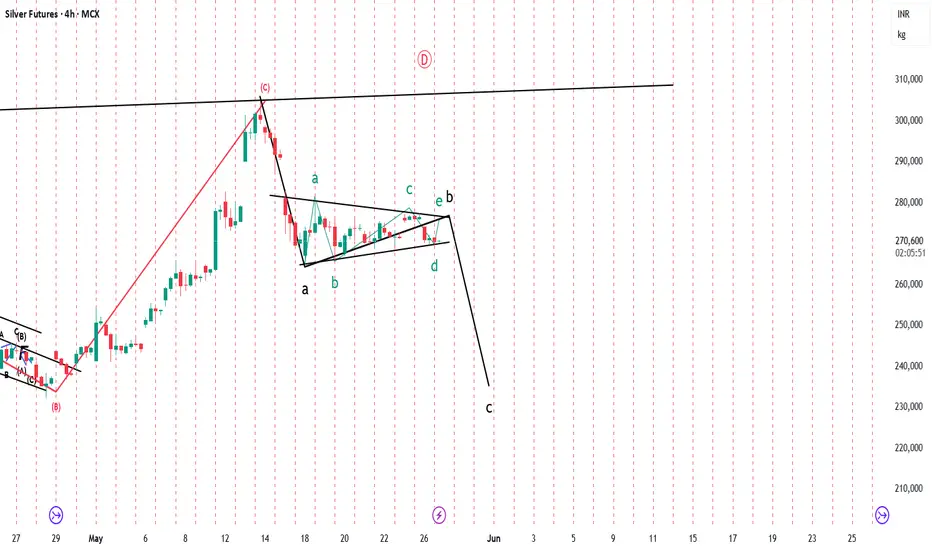
Why Silver Looks Bearish
Several technical factors are now aligning toward a bearish outlook:
1. Completion of Corrective Structure
The triangle consolidation appears mature, with all five internal legs potentially completed.
2. Weak Recovery Momentum
Despite multiple attempts, Silver has failed to reclaim higher resistance levels, showing lack of strong buying participation.
3. Lower High Formation
The structure continues to print lower highs after the major top, indicating seller dominance.
4. Breakdown Projection
The projected path on the chart suggests a strong impulsive “Wave C” decline once the lower support boundary breaks.
5. NeoWave Characteristics
The internal overlaps, slowing momentum, and contracting price behavior are classic characteristics of a terminal corrective structure before a directional expansion move.
Expected Market Move
The preferred scenario suggests:
Final completion of wave “e”
Breakdown below triangle support
Strong impulsive downside move
Acceleration toward lower support zones
The projected Wave C decline could be sharp and fast, as triangles are often followed by explosive directional moves.
Key Levels to Watch
Resistance Zone
276,000 – 280,000
Breakdown Trigger
Sustained move below triangle support near 268,000–270,000
Bearish Targets
250,000
240,000
230,000 zone (projected Wave C region)
Several technical factors are now aligning toward a bearish outlook:
1. Completion of Corrective Structure
The triangle consolidation appears mature, with all five internal legs potentially completed.
2. Weak Recovery Momentum
Despite multiple attempts, Silver has failed to reclaim higher resistance levels, showing lack of strong buying participation.
3. Lower High Formation
The structure continues to print lower highs after the major top, indicating seller dominance.
4. Breakdown Projection
The projected path on the chart suggests a strong impulsive “Wave C” decline once the lower support boundary breaks.
5. NeoWave Characteristics
The internal overlaps, slowing momentum, and contracting price behavior are classic characteristics of a terminal corrective structure before a directional expansion move.
Expected Market Move
The preferred scenario suggests:
Final completion of wave “e”
Breakdown below triangle support
Strong impulsive downside move
Acceleration toward lower support zones
The projected Wave C decline could be sharp and fast, as triangles are often followed by explosive directional moves.
Key Levels to Watch
Resistance Zone
276,000 – 280,000
Breakdown Trigger
Sustained move below triangle support near 268,000–270,000
Bearish Targets
250,000
240,000
230,000 zone (projected Wave C region)
Trade closed: target reached

Disclaimer
The information and publications are not meant to be, and do not constitute, financial, investment, trading, or other types of advice or recommendations supplied or endorsed by TradingView. Read more in the Terms of Use.
Disclaimer
The information and publications are not meant to be, and do not constitute, financial, investment, trading, or other types of advice or recommendations supplied or endorsed by TradingView. Read more in the Terms of Use.