
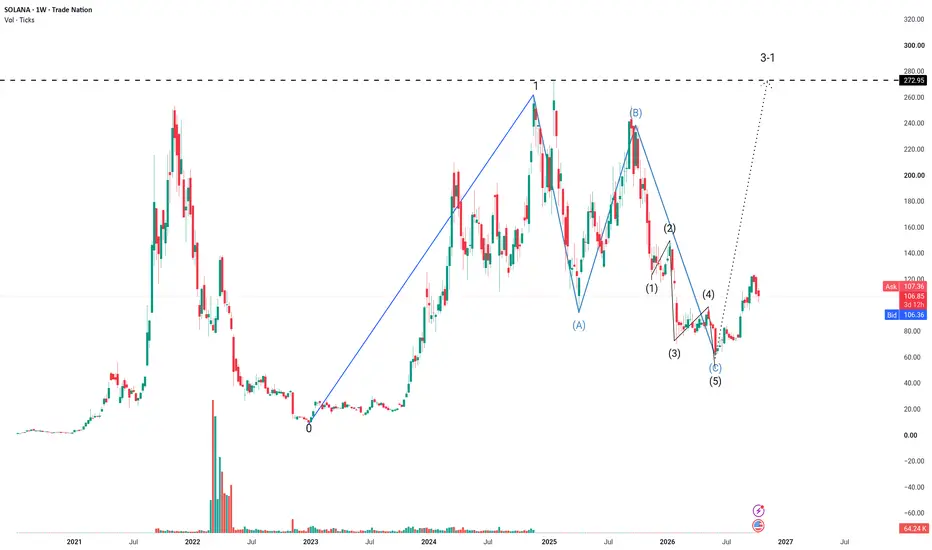
1. Primary Wave Structure Breakdown
* Cycle Wave I (Grand Supercycle/Primary Bull Wave): Dec 2022 low up to the November 2024 / January 2025 peak ($293–$295 ATH region).
* Cycle Wave II (Corrective Phase): An ABC Irregular (Expanded) Flat correction following the peak.
* Wave A: Initial sharp downside reaction.
* Wave B: Corrective counter-trend bounce that typically retraces near or slightly above the prior wave origin/ATH.
* Wave C: A terminal 5-subwave impulse structure (waves 1-2-3-4-5) completing the low of the flat correction.
* Cycle Wave III (New Main Bull Wave): Begins immediately following the completion of Wave C's 5th subwave. This new impulsive sequence unfolds in 5 distinct subwaves (labeled as 1, 2, 3, 4, 5 or i, ii, iii, iv, v).
2. Setting Up the Target on TradingView
* Dotted Line Projection (Wave 1 of III):
* Use the Trend-Based Fib Extension tool (or Price Range tool) anchored from the bottom of Wave C to the peak of subwave 1 of the new bull wave.
* Set your primary visual projection target line (dotted) directly at the All-Time High ($293–$295) level, which typically aligns with the completion target of the initial impulsive subwave or a key resistance overlap before minor wave 2 retracement.
3. Recommended TradingView Tools to Use
* Elliott Wave (Impulse) Tool (12345): Map out the 5 subwaves of the new impulse wave starting from the Wave C termination low.
* Trend-Based Fib Extension: Drag from Wave C low \rightarrow Wave 1 peak \rightarrow Wave 2 trough to project subsequent targets (such as the 1.618 extension for Wave 3).
* Cycle Wave I (Grand Supercycle/Primary Bull Wave): Dec 2022 low up to the November 2024 / January 2025 peak ($293–$295 ATH region).
* Cycle Wave II (Corrective Phase): An ABC Irregular (Expanded) Flat correction following the peak.
* Wave A: Initial sharp downside reaction.
* Wave B: Corrective counter-trend bounce that typically retraces near or slightly above the prior wave origin/ATH.
* Wave C: A terminal 5-subwave impulse structure (waves 1-2-3-4-5) completing the low of the flat correction.
* Cycle Wave III (New Main Bull Wave): Begins immediately following the completion of Wave C's 5th subwave. This new impulsive sequence unfolds in 5 distinct subwaves (labeled as 1, 2, 3, 4, 5 or i, ii, iii, iv, v).
2. Setting Up the Target on TradingView
* Dotted Line Projection (Wave 1 of III):
* Use the Trend-Based Fib Extension tool (or Price Range tool) anchored from the bottom of Wave C to the peak of subwave 1 of the new bull wave.
* Set your primary visual projection target line (dotted) directly at the All-Time High ($293–$295) level, which typically aligns with the completion target of the initial impulsive subwave or a key resistance overlap before minor wave 2 retracement.
3. Recommended TradingView Tools to Use
* Elliott Wave (Impulse) Tool (12345): Map out the 5 subwaves of the new impulse wave starting from the Wave C termination low.
* Trend-Based Fib Extension: Drag from Wave C low \rightarrow Wave 1 peak \rightarrow Wave 2 trough to project subsequent targets (such as the 1.618 extension for Wave 3).

Disclaimer
The information and publications are not meant to be, and do not constitute, financial, investment, trading, or other types of advice or recommendations supplied or endorsed by TradingView. Read more in the Terms of Use.
Disclaimer
The information and publications are not meant to be, and do not constitute, financial, investment, trading, or other types of advice or recommendations supplied or endorsed by TradingView. Read more in the Terms of Use.