
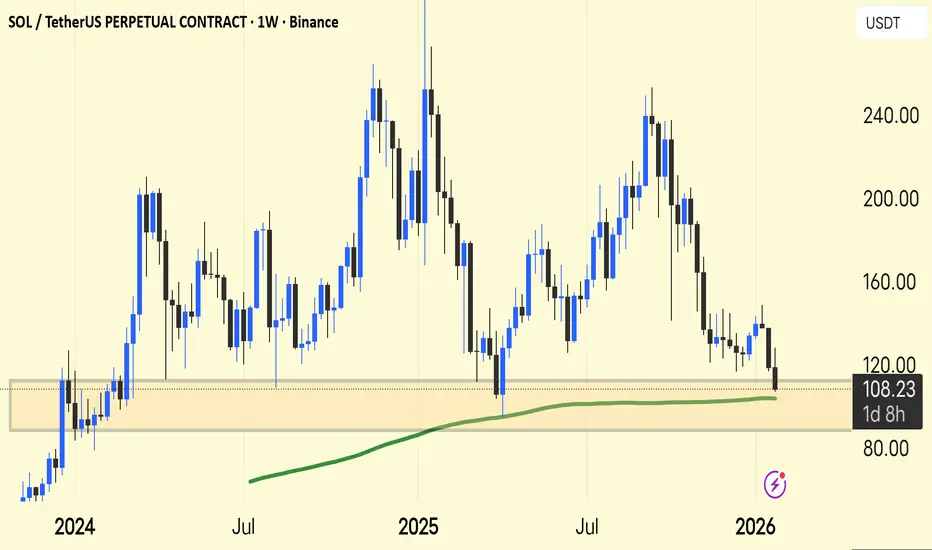
SOL/USDT — Weekly Chart Update
SOL is testing a major demand zone around $100–110, right where price has reacted multiple times before.
The 200-week MA (green) is just below price — a key long-term support area.
Market structure is still lower highs after the $240 peak → medium-term pressure remains.
Hold above $100 = base building & potential bounce toward $130–150.
Weekly close below $100 = risk of deeper pullback toward $80–90.
Summary: This is a make-or-break zone for SOL. Bulls need to defend here to flip momentum.
SOL is testing a major demand zone around $100–110, right where price has reacted multiple times before.
The 200-week MA (green) is just below price — a key long-term support area.
Market structure is still lower highs after the $240 peak → medium-term pressure remains.
Hold above $100 = base building & potential bounce toward $130–150.
Weekly close below $100 = risk of deeper pullback toward $80–90.
Summary: This is a make-or-break zone for SOL. Bulls need to defend here to flip momentum.

Related publications
Disclaimer
The information and publications are not meant to be, and do not constitute, financial, investment, trading, or other types of advice or recommendations supplied or endorsed by TradingView. Read more in the Terms of Use.
Related publications
Disclaimer
The information and publications are not meant to be, and do not constitute, financial, investment, trading, or other types of advice or recommendations supplied or endorsed by TradingView. Read more in the Terms of Use.