
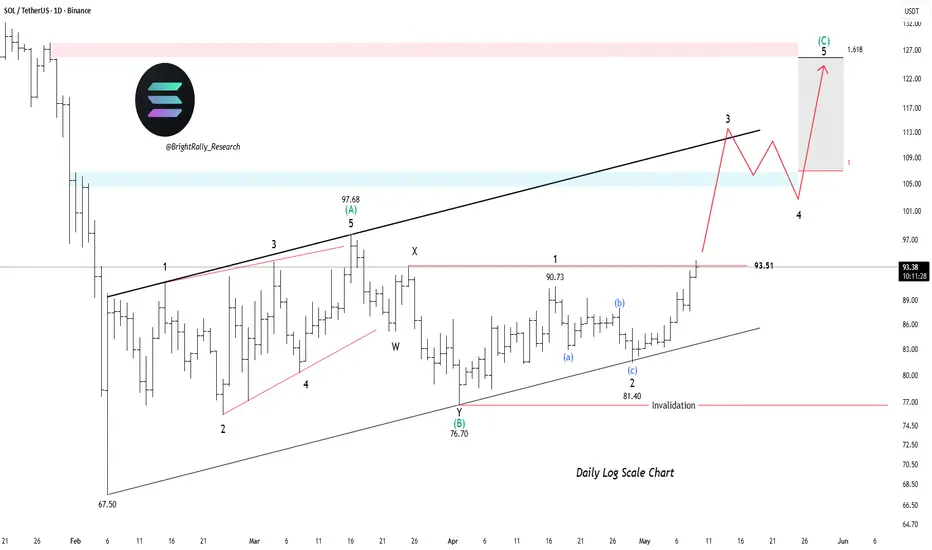
SOLUSDT on the daily chart is starting to regain strength after holding the broader ascending structure from the 76 low. Price spent the last few weeks consolidating above the trendline instead of breaking below it, which shows buyers are still defending the higher timeframe trend. The recent push back above the 90.73 resistance area is an early sign that momentum may be shifting back toward the upside.
The corrective move also looks relatively controlled compared to the earlier rally. Instead of aggressive selling, SOL formed a series of higher lows while staying inside the rising structure. That usually points toward accumulation rather than distribution.
Momentum is slowly improving as price continues pressing higher from the recent base around 81.40. Buyers are beginning to reclaim short-term resistance zones, and the structure now looks stronger than it did during the previous consolidation phase.
The main breakout area to watch is around the upper resistance zone near 97 – 98. A clean move above that region could open the next leg higher and confirm continuation of the broader trend.
If SOL manages to maintain strength above the recent breakout area, the next upside targets come in at 102.24, 109.78, and 118.8.
We will update further information soon.
The corrective move also looks relatively controlled compared to the earlier rally. Instead of aggressive selling, SOL formed a series of higher lows while staying inside the rising structure. That usually points toward accumulation rather than distribution.
Momentum is slowly improving as price continues pressing higher from the recent base around 81.40. Buyers are beginning to reclaim short-term resistance zones, and the structure now looks stronger than it did during the previous consolidation phase.
The main breakout area to watch is around the upper resistance zone near 97 – 98. A clean move above that region could open the next leg higher and confirm continuation of the broader trend.
If SOL manages to maintain strength above the recent breakout area, the next upside targets come in at 102.24, 109.78, and 118.8.
We will update further information soon.

Related publications
Disclaimer
The information and publications are not meant to be, and do not constitute, financial, investment, trading, or other types of advice or recommendations supplied or endorsed by TradingView. Read more in the Terms of Use.
Related publications
Disclaimer
The information and publications are not meant to be, and do not constitute, financial, investment, trading, or other types of advice or recommendations supplied or endorsed by TradingView. Read more in the Terms of Use.