
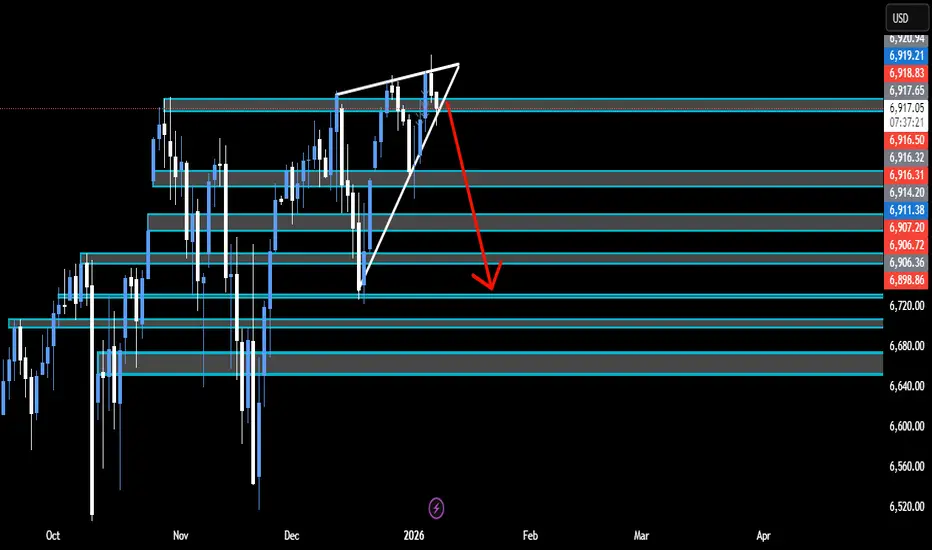
Daily Time Frame- Rising Wedge is a bearish reversal pattern. If the Daily breaks out of this pattern at any point towards the downside we should see price reach the previous support levels around 6840.00.
4H Time Frame- Created Bearish Divergence on the Relative Strength Index indicator (RSI). Higher highs are being made in price but lower highs on indicator.
1H time Frame and down has a head and shoulders pattern. Currently sitting at right shoulder. This could be bearish indication for today market.
4H Time Frame- Created Bearish Divergence on the Relative Strength Index indicator (RSI). Higher highs are being made in price but lower highs on indicator.
1H time Frame and down has a head and shoulders pattern. Currently sitting at right shoulder. This could be bearish indication for today market.

Disclaimer
The information and publications are not meant to be, and do not constitute, financial, investment, trading, or other types of advice or recommendations supplied or endorsed by TradingView. Read more in the Terms of Use.
Disclaimer
The information and publications are not meant to be, and do not constitute, financial, investment, trading, or other types of advice or recommendations supplied or endorsed by TradingView. Read more in the Terms of Use.