
📊 SPARC |
Monthly Chart Analysis
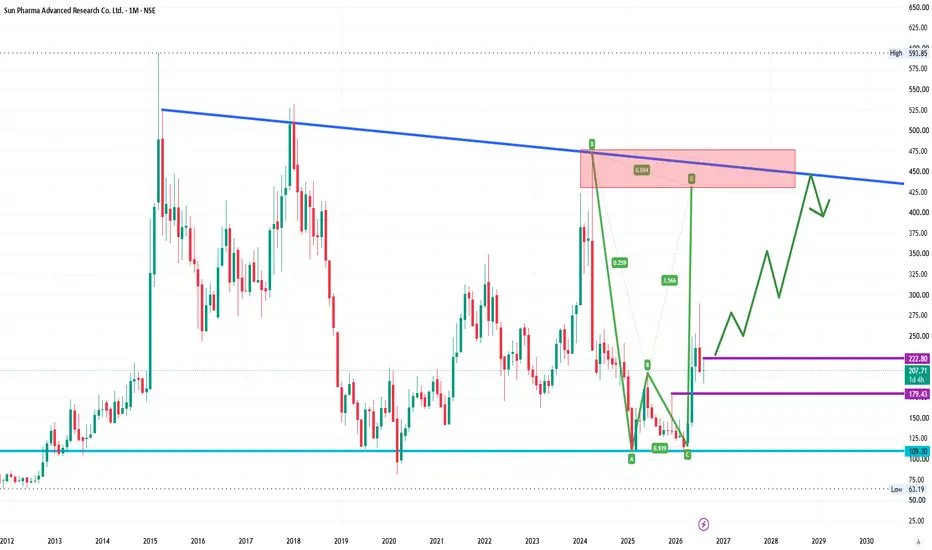
A Potential Bearish Harmonic X-A-B-C-D pattern is developing on the monthly chart.
🔥 Strong Resistance / PRZ: ₹430–₹475
📉 Major Trendline Resistance: ~₹450
🟢 Bullish Scenario
Above ₹225 on a strong monthly close:
🎯 ₹300 → ₹350 → ₹400+
🔴 Bearish Scenario
Rejection from ₹180–₹170 + breakdown:
🎯 ₹140 → ₹100
📌 Current Price: ~₹208
📌 Major Support: ₹100–₹110
📌 Key Decision Zone: ₹430–₹475
The ₹430–₹475 zone is the BIG level to watch.
⚠️ Pattern confirmation is required before taking any trade.
⚠️ Technical analysis only. Not a buy/sell recommendation.
#SPARC #HarmonicPattern #TechnicalAnalysis #NSE #StockMarket #SwingTrading #PriceAction
Monthly Chart Analysis
A Potential Bearish Harmonic X-A-B-C-D pattern is developing on the monthly chart.
🔥 Strong Resistance / PRZ: ₹430–₹475
📉 Major Trendline Resistance: ~₹450
🟢 Bullish Scenario
Above ₹225 on a strong monthly close:
🎯 ₹300 → ₹350 → ₹400+
🔴 Bearish Scenario
Rejection from ₹180–₹170 + breakdown:
🎯 ₹140 → ₹100
📌 Current Price: ~₹208
📌 Major Support: ₹100–₹110
📌 Key Decision Zone: ₹430–₹475
The ₹430–₹475 zone is the BIG level to watch.
⚠️ Pattern confirmation is required before taking any trade.
⚠️ Technical analysis only. Not a buy/sell recommendation.
#SPARC #HarmonicPattern #TechnicalAnalysis #NSE #StockMarket #SwingTrading #PriceAction

Disclaimer
The information and publications are not meant to be, and do not constitute, financial, investment, trading, or other types of advice or recommendations supplied or endorsed by TradingView. Read more in the Terms of Use.
Disclaimer
The information and publications are not meant to be, and do not constitute, financial, investment, trading, or other types of advice or recommendations supplied or endorsed by TradingView. Read more in the Terms of Use.