
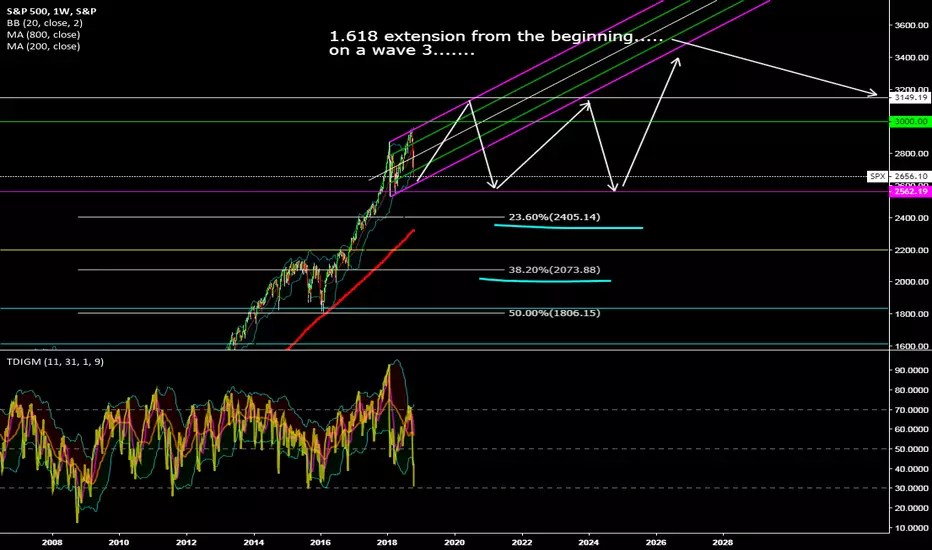
Ok, try to stay with me here.... If we look at SandP in plain old Elliot wave, I see 2 possibilities.... Either all hell breaks loose and it just drops to the 23-38% fib levels and into a wave 4 correction, OR... it will rally again in the form of an ending diagonal considering we should be on wave 5 of a larger degree wave 3. What I find interesting is that if I slide the fib retrace from the high it just made up to the up to the 1.618 extension (white line, typical for a wave 3), the 23% fib retrace slides up and lines up perfectly with the trend fibonacci from beginning of time through the wave patterns (it should anyway, 1.236 extension). The 3000 level should be of some significance also. If you look at past market declines, you can see some higher time frame candlestick action occurring beforehand. It can break the fork and make some kind of smaller flat pattern also before continuing up. I just feel like Donald Trump has been well aware of the math of the market and does not want to be known as a President who had a market crash, considering his wallet and ego.

Disclaimer
The information and publications are not meant to be, and do not constitute, financial, investment, trading, or other types of advice or recommendations supplied or endorsed by TradingView. Read more in the Terms of Use.
Disclaimer
The information and publications are not meant to be, and do not constitute, financial, investment, trading, or other types of advice or recommendations supplied or endorsed by TradingView. Read more in the Terms of Use.