
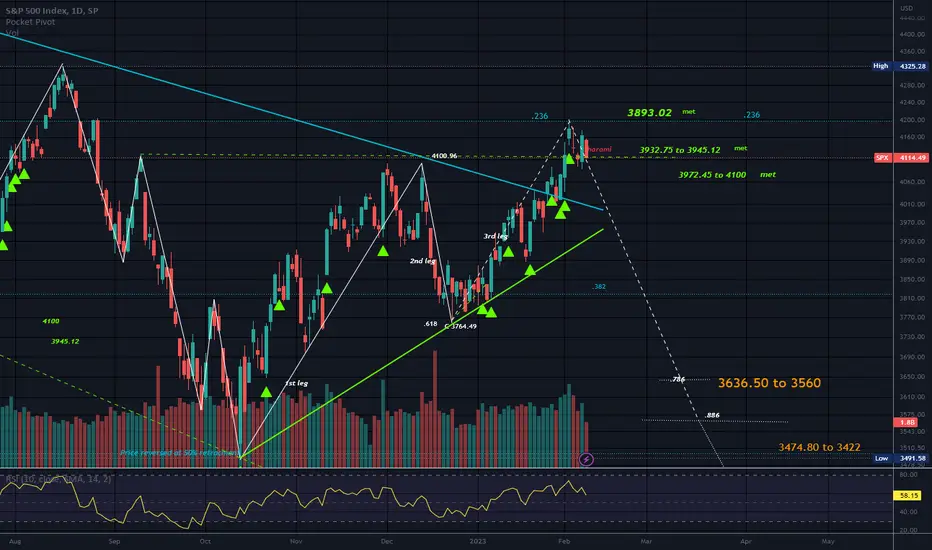
Price is just below the .236 fib level of the trend up since the Covid low.
Price is above a Symmetrical Triangle that can provide support.
Possible M pattern noted that could take this lower. I am not positive the 3rd leg is complete. If this is an M pattern, then it could be a Shark.
The .786 is there in case this is a Cypher but Cyphers are less common than Sharks.
The Shark completes the 4th leg at the .886 and in some cases, the 1.113.
Watching to assure 3rd leg is complete.
No recommendation.
Targets 2 are smaller than T1. T2 are targets if T1 is passed.
Bearish Harami candle pattern at this moment that can change by close.
Price is above a Symmetrical Triangle that can provide support.
Possible M pattern noted that could take this lower. I am not positive the 3rd leg is complete. If this is an M pattern, then it could be a Shark.
The .786 is there in case this is a Cypher but Cyphers are less common than Sharks.
The Shark completes the 4th leg at the .886 and in some cases, the 1.113.
Watching to assure 3rd leg is complete.
No recommendation.
Targets 2 are smaller than T1. T2 are targets if T1 is passed.
Bearish Harami candle pattern at this moment that can change by close.
Note
2-12 Bearish Rising Wedge
Disclaimer
The information and publications are not meant to be, and do not constitute, financial, investment, trading, or other types of advice or recommendations supplied or endorsed by TradingView. Read more in the Terms of Use.
Disclaimer
The information and publications are not meant to be, and do not constitute, financial, investment, trading, or other types of advice or recommendations supplied or endorsed by TradingView. Read more in the Terms of Use.