
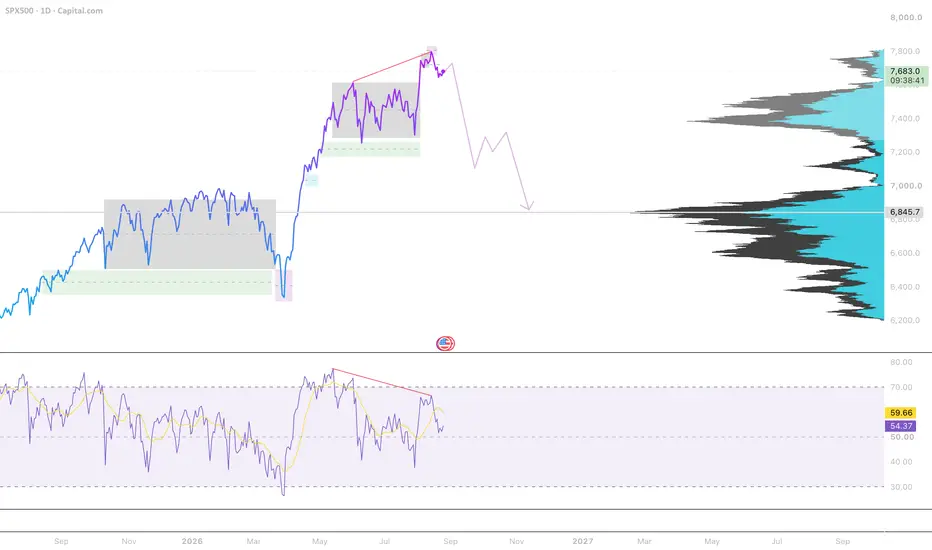
SPX500: Bearish RSI Divergence Signals a Potential Correction
The S&P 500 has broken above its previous consolidation range and reached a new high near 7,800. However, momentum is not confirming the move: while price formed a higher high, the RSI printed a lower high, creating a clear bearish divergence on the daily chart.
This suggests that the current breakout may be losing strength. A final retest of the recent high is still possible, but failure to hold above the breakout area could trigger a broader correction.
My main downside target is the high-volume support zone around 6,845. The move may not happen in a straight line, as intermediate reactions and rebounds are likely around 7,200–7,300.
Key levels:
• Resistance: 7,780–7,820
• Intermediate support: 7,200–7,300
• Main downside target: 6,845
A sustained daily close above the recent high would weaken the bearish scenario.
This is a technical scenario, not financial advice.
The S&P 500 has broken above its previous consolidation range and reached a new high near 7,800. However, momentum is not confirming the move: while price formed a higher high, the RSI printed a lower high, creating a clear bearish divergence on the daily chart.
This suggests that the current breakout may be losing strength. A final retest of the recent high is still possible, but failure to hold above the breakout area could trigger a broader correction.
My main downside target is the high-volume support zone around 6,845. The move may not happen in a straight line, as intermediate reactions and rebounds are likely around 7,200–7,300.
Key levels:
• Resistance: 7,780–7,820
• Intermediate support: 7,200–7,300
• Main downside target: 6,845
A sustained daily close above the recent high would weaken the bearish scenario.
This is a technical scenario, not financial advice.

Disclaimer
The information and publications are not meant to be, and do not constitute, financial, investment, trading, or other types of advice or recommendations supplied or endorsed by TradingView. Read more in the Terms of Use.
Disclaimer
The information and publications are not meant to be, and do not constitute, financial, investment, trading, or other types of advice or recommendations supplied or endorsed by TradingView. Read more in the Terms of Use.