
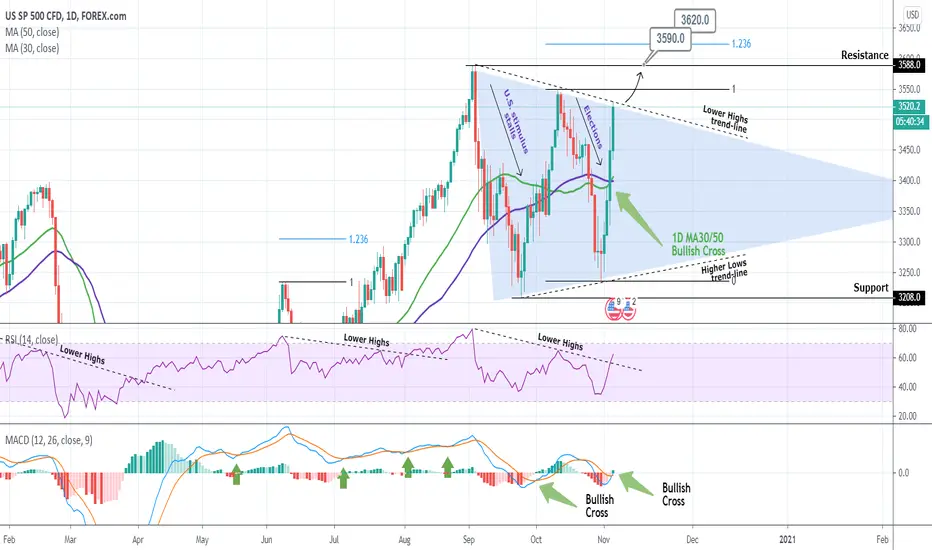
Since the September 03 Top (All Time High), S&P500 has entered a volatile pattern in the form of a Triangle. The major drivers of this weakness have fundamentally been the U.S. stimulus being delayed and then the elections.
Today the Lower Highs trend-line of this Triangle is being tested. If broken, I expect the 3590 Resistance to be tested, with an extension to the 1.236 Fibonacci at 3620 as it happened with the July 23 extension.
The reason I give more probabilities to an upward break-out from the Triangle is the fact that the MACD on the 1D time-frame has (just) formed a Bullish Cross much earlier than the previous time, something that may accumulate buyers. Also the RSI has broken above its Lower Highs trend-line already, something that was a bullish signal 1 year back. On top of that the MA30 just crossed above the MA50 which on a one month horizon at least, has historically been a bullish signal (we have to go years back to see immediate selling after a 1D MA30/50 Bullish Cross.
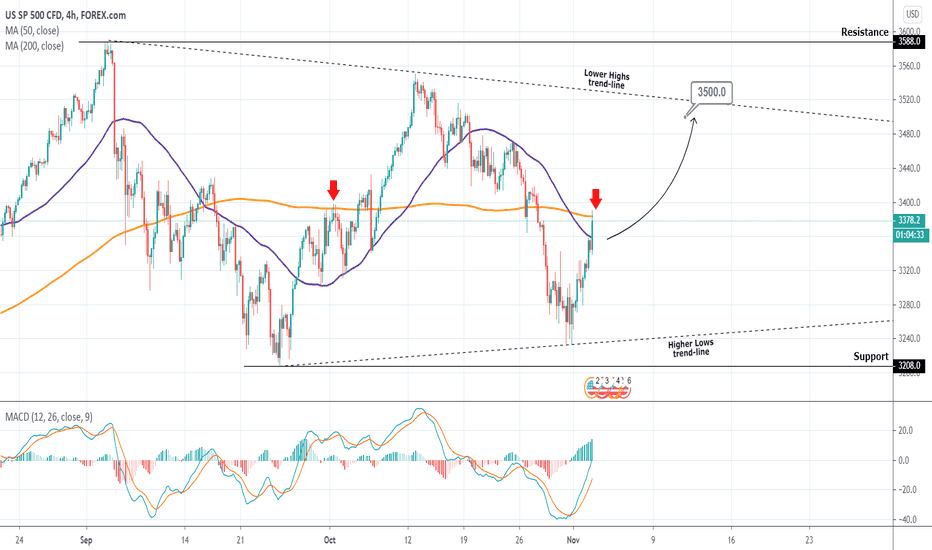
Most recent trade on S&P500:
** Please support this idea with your likes and comments, it is the best way to keep it relevant and support me. **
--------------------------------------------------------------------------------------------------------
!! Donations via TradingView coins also help me a great deal at posting more free trading content and signals here !!
🎉 👍 Shout-out to TradingShot's 💰 top TradingView Coin donor 💰 this week ==> didogetsov
--------------------------------------------------------------------------------------------------------
Today the Lower Highs trend-line of this Triangle is being tested. If broken, I expect the 3590 Resistance to be tested, with an extension to the 1.236 Fibonacci at 3620 as it happened with the July 23 extension.
The reason I give more probabilities to an upward break-out from the Triangle is the fact that the MACD on the 1D time-frame has (just) formed a Bullish Cross much earlier than the previous time, something that may accumulate buyers. Also the RSI has broken above its Lower Highs trend-line already, something that was a bullish signal 1 year back. On top of that the MA30 just crossed above the MA50 which on a one month horizon at least, has historically been a bullish signal (we have to go years back to see immediate selling after a 1D MA30/50 Bullish Cross.
Most recent trade on S&P500:
** Please support this idea with your likes and comments, it is the best way to keep it relevant and support me. **
--------------------------------------------------------------------------------------------------------
!! Donations via TradingView coins also help me a great deal at posting more free trading content and signals here !!
🎉 👍 Shout-out to TradingShot's 💰 top TradingView Coin donor 💰 this week ==> didogetsov
--------------------------------------------------------------------------------------------------------

I trade Crypto, Forex, Indices & Commodities on PrimeXBT — all from one account with TradingView charts 👉 tradingshot.short.gy/PrimeXBT
I also use TradeNation for fixed spreads & zero commission 👉 tradingshot.short.gy/Tradenation
I also use TradeNation for fixed spreads & zero commission 👉 tradingshot.short.gy/Tradenation
Disclaimer
The information and publications are not meant to be, and do not constitute, financial, investment, trading, or other types of advice or recommendations supplied or endorsed by TradingView. Read more in the Terms of Use.
I trade Crypto, Forex, Indices & Commodities on PrimeXBT — all from one account with TradingView charts 👉 tradingshot.short.gy/PrimeXBT
I also use TradeNation for fixed spreads & zero commission 👉 tradingshot.short.gy/Tradenation
I also use TradeNation for fixed spreads & zero commission 👉 tradingshot.short.gy/Tradenation
Disclaimer
The information and publications are not meant to be, and do not constitute, financial, investment, trading, or other types of advice or recommendations supplied or endorsed by TradingView. Read more in the Terms of Use.