
This post was published on 15.2.26, as you can see in the screenshot. But about a week ago, it was blocked due to my violation of certain rules, along with 14 entry points I published. Since the pattern is fundamental, I would like to keep this post, so I'm publishing it again

There are basic, fundamental, yet very simple patterns in the market that, for some reason, people ignore. In light of how the market currently looks, I'd like to remind you of one of them - the liquidation of liquidity zones
The longer an asset accumulates, the more extremes are formed, behind which, naturally, a large amount of liquidity gathers, and the market, in most cases, heads towards this accumulated liquidity
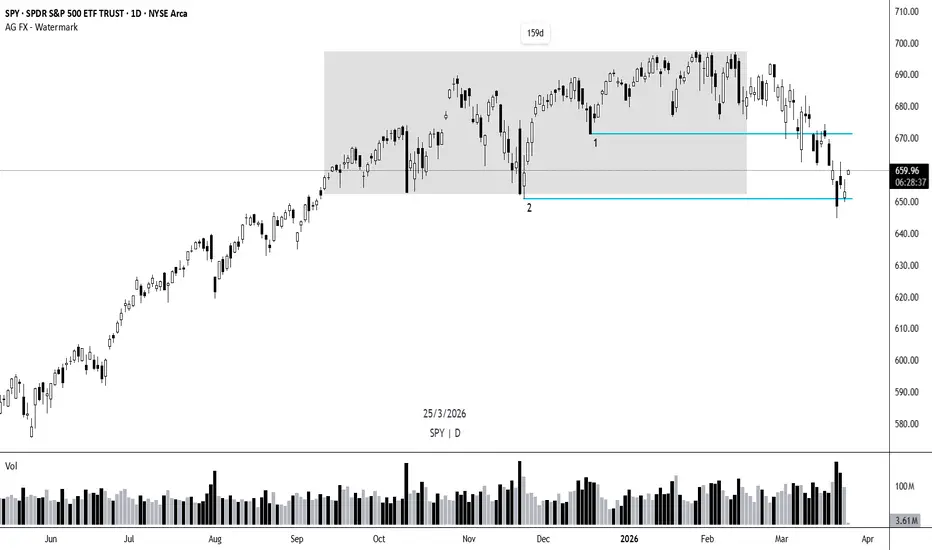
The screenshots show examples of how this looks on SPY, but you can independently open any asset and discover that the liquidation of liquidity zones occurs in 60%+ of cases, which in itself is an excellent statistical edge


Obviously, the statistically most likely development is the liquidation of liquidity at levels 1 and 2. Of course, this may not happen, but we think strictly within the framework of statistical edge, and it suggests that the probability of a correction/reversal is high
At the same time, I personally don't see any prerequisites for a global reversal and the start of a bear market, because if you look at the macro data over the last six months, it's not just not deteriorating - it's actually improving
UPD: At the moment, after a little more than a month, the situation has not changed much, but there are serious prerequisites for the situation to worsen in the future
Conclusion: in my opinion, the most likely development is a correction with the taking out of liquidity zones, buying on volume, a reversal, and the start of a new wave of growth. One of the main factor that could accelerate or break this scenario is, obviously, geopolitics
Examples of applying the pattern:
-Using this zone as a take-profit target
-Using this zone as an entry point
-When investing monthly, in the month when liquidity is taken out, buy assets at 1.5-2x the standard amount
-When trading, for example, breakouts, skip entry points if there hasn't been a liquidity grab from the opposite side

There are basic, fundamental, yet very simple patterns in the market that, for some reason, people ignore. In light of how the market currently looks, I'd like to remind you of one of them - the liquidation of liquidity zones
The longer an asset accumulates, the more extremes are formed, behind which, naturally, a large amount of liquidity gathers, and the market, in most cases, heads towards this accumulated liquidity
The screenshots show examples of how this looks on SPY, but you can independently open any asset and discover that the liquidation of liquidity zones occurs in 60%+ of cases, which in itself is an excellent statistical edge
Obviously, the statistically most likely development is the liquidation of liquidity at levels 1 and 2. Of course, this may not happen, but we think strictly within the framework of statistical edge, and it suggests that the probability of a correction/reversal is high
At the same time, I personally don't see any prerequisites for a global reversal and the start of a bear market, because if you look at the macro data over the last six months, it's not just not deteriorating - it's actually improving
UPD: At the moment, after a little more than a month, the situation has not changed much, but there are serious prerequisites for the situation to worsen in the future
Conclusion: in my opinion, the most likely development is a correction with the taking out of liquidity zones, buying on volume, a reversal, and the start of a new wave of growth. One of the main factor that could accelerate or break this scenario is, obviously, geopolitics
Examples of applying the pattern:
-Using this zone as a take-profit target
-Using this zone as an entry point
-When investing monthly, in the month when liquidity is taken out, buy assets at 1.5-2x the standard amount
-When trading, for example, breakouts, skip entry points if there hasn't been a liquidity grab from the opposite side

Disclaimer
The information and publications are not meant to be, and do not constitute, financial, investment, trading, or other types of advice or recommendations supplied or endorsed by TradingView. Read more in the Terms of Use.
Disclaimer
The information and publications are not meant to be, and do not constitute, financial, investment, trading, or other types of advice or recommendations supplied or endorsed by TradingView. Read more in the Terms of Use.