
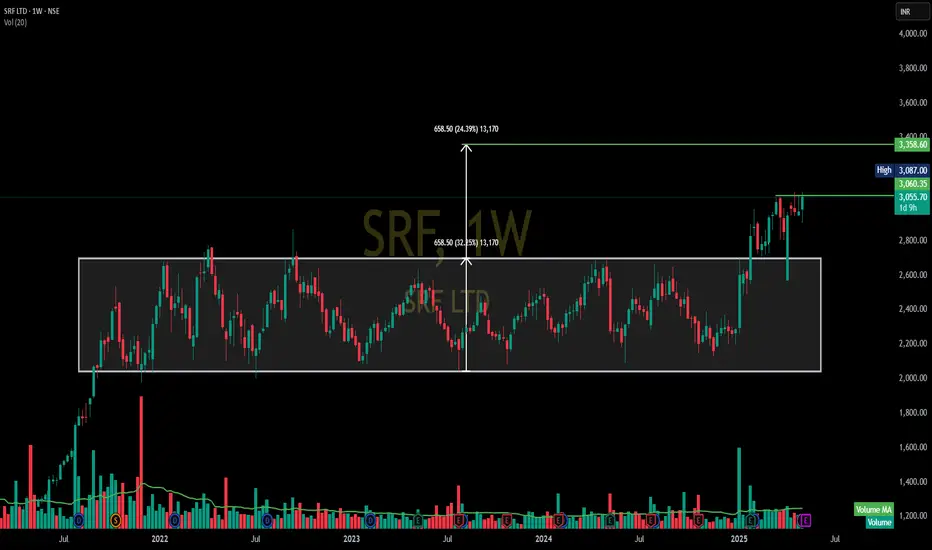
Pattern: The chart shows a very long period of Box Consolidation or a Rectangular Range. The price has been trading within a broad range roughly between 2,060 and 2,700 from late 2021/early 2022 until early 2025.
Breakout: In early 2025, the stock has decisively broken out above the upper boundary of this multi-year consolidation range (around 2,700).
Volume: There's a significant increase in volume accompanying the breakout, which is a strong bullish confirmation.
Target: The height of the consolidation box (approximately 658.50 points) is projected upwards from the breakout point. This suggests a target of around 3,358.60.
Support: The upper boundary of the consolidation range (around 2,700) is now a very strong support level.
Resistance: The immediate resistance is the recent high around 3,060.35. The primary target is 3,358.60.
Interpretation: The breakout from a multi-year consolidation on a weekly chart is a very significant bullish development. This suggests the beginning of a new, potentially strong uptrend. The stock is likely to head towards its target of 3,358.60, with the 2,700 level acting as a robust base.

Disclaimer
The information and publications are not meant to be, and do not constitute, financial, investment, trading, or other types of advice or recommendations supplied or endorsed by TradingView. Read more in the Terms of Use.
Disclaimer
The information and publications are not meant to be, and do not constitute, financial, investment, trading, or other types of advice or recommendations supplied or endorsed by TradingView. Read more in the Terms of Use.