
________________________________________
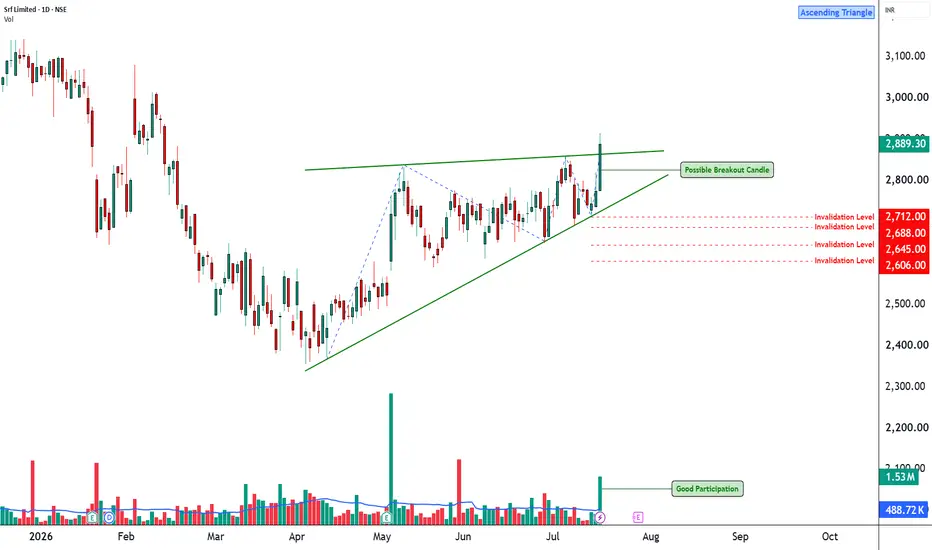
📊 SRF: Daily Technical Snapshot – Ascending Triangle Breakout (Possible)
📊 STWP Technical Analysis
________________________________________
MARKET STRUCTURE SNAPSHOT | NSE: SRF | DAILY
Closing Price: ₹2,889.30 (+₹113.70 | +4.10%)
Core Trend: Strong Uptrend
Market State: Confirmed Breakout in Progress
Price Structure: Price has broken above an Ascending Triangle, supported by a strong bullish candle and exceptionally high trading volume. The breakout reflects increasing buying pressure following a period of consolidation.
________________________________________
OPERATIONAL PRICE GRID & KEY REFERENCE LEVELS
Model Reference Level: ₹2,916.00
Hard Invalidation Level: ₹2,606.80
Structural Risk: ₹309.20 (10.60%)
Resistance Levels: R1 ₹2,944.50 | R2 ₹2,999.70 | R3 ₹3,083.40
Support Levels: S1 ₹2,805.60 | S2 ₹2,721.90 | S3 ₹2,666.70
Range Structure: Low ₹2,606.80 | High ₹3,083.40
Higher Timeframe Observation Zones: ₹3,000 | ₹3,083 | ₹3,150
________________________________________
MOMENTUM, PARTICIPATION & CPR DATA
Volume Profile: 1.53 Million Shares
Volume Character: Extremely High Relative Participation
RSI: 63.62 (Strong Momentum Zone)
ADX: 10.48 (Early Trend Development)
ROC: +3.21%
MACD Status: Fresh Bullish Crossover
CCI: +198.29 (Strong Bullish Momentum)
Stochastic Reading: 90.01 (Extended Momentum Zone)
Current Bias: BUY ON PULLBACKS
CPR State: Bullish Zone | CPR Moving Up (Narrow)
Today's CPR: Pivot ₹2,777.55 | Top ₹2,776.55 | Base ₹2,778.50
Tomorrow's CPR (Projected): Pivot ₹2,860.80 | Top ₹2,875.05 | Base ₹2,846.55
________________________________________
📚 EDUCATIONAL OBSERVATION
SRF has confirmed a breakout from an Ascending Triangle, a bullish continuation pattern that often develops during an established uptrend. The pattern is characterised by a series of higher lows, indicating increasing buyer aggression, while repeated tests of a relatively flat resistance level gradually absorb selling pressure. The eventual breakout above resistance suggests that buyers have gained control and that the prior uptrend may be ready to resume.
The latest breakout is supported by a strong bullish candle, exceptionally high trading volume and expanding momentum, reflecting broad market participation. Increased volume during a triangle breakout generally strengthens the reliability of the move, as it indicates that the breakout is supported by genuine buying interest rather than low-volume price fluctuations.
Momentum indicators continue to remain constructive. The RSI at 63.62 reflects healthy bullish momentum without reaching extreme overbought territory. MACD has generated a fresh bullish crossover, signalling improving trend strength, while the ROC of +3.21% indicates continued upside acceleration. The CCI reading of +198.29 confirms strong buying momentum, and the Stochastic reading of 90.01 reflects sustained participation, although elevated momentum readings may occasionally lead to short-term consolidations.
The projected Central Pivot Range (CPR) for the next trading session has shifted higher, with the projected Pivot at ₹2,860.80. A rising CPR generally indicates improving market acceptance of higher prices and often supports trend continuation when accompanied by strong participation. The dashboard therefore continues to maintain a Buy on Pullbacks approach rather than chasing prices after a sharp advance.
The immediate technical focus remains on the resistance zone between ₹2,945 and ₹3,000. Sustained trading above this region could reinforce the breakout and bring the higher-timeframe observation zones near ₹3,083 and ₹3,150 into focus. On the downside, ₹2,806 remains the first important support, while the structural invalidation level is positioned near ₹2,607.
________________________________________
🏢 BUSINESS OVERVIEW
SRF Limited is a diversified chemicals and manufacturing company with businesses spanning specialty chemicals, fluorochemicals, packaging films and technical textiles. The company continues to benefit from increasing global demand for specialty chemicals, expanding export opportunities and ongoing capacity additions across its high-margin businesses. Its diversified product portfolio and focus on innovation provide a constructive long-term business outlook.
________________________________________
📖 Educational Note
Support and resistance levels should be treated as observation zones rather than predictive targets. Chart patterns, price action, volume analysis, momentum indicators and CPR are educational tools that help market participants understand evolving market structure within a disciplined risk-management framework.
________________________________________
⚠️ Disclaimer
This analysis is provided strictly for educational and informational purposes.
It does not constitute financial, investment or trading advice and should not be interpreted as a recommendation to buy or sell any security.
Investments in the stock market are subject to market risks, including the possible loss of capital.
Historical performance, chart patterns and technical indicators do not guarantee future results.
Please conduct your own research and consult a SEBI-registered investment adviser before making investment decisions.
STWP assumes no responsibility or liability for any financial loss arising directly or indirectly from the use of this analysis.
📊 SRF: Daily Technical Snapshot – Ascending Triangle Breakout (Possible)
📊 STWP Technical Analysis
________________________________________
MARKET STRUCTURE SNAPSHOT | NSE: SRF | DAILY
Closing Price: ₹2,889.30 (+₹113.70 | +4.10%)
Core Trend: Strong Uptrend
Market State: Confirmed Breakout in Progress
Price Structure: Price has broken above an Ascending Triangle, supported by a strong bullish candle and exceptionally high trading volume. The breakout reflects increasing buying pressure following a period of consolidation.
________________________________________
OPERATIONAL PRICE GRID & KEY REFERENCE LEVELS
Model Reference Level: ₹2,916.00
Hard Invalidation Level: ₹2,606.80
Structural Risk: ₹309.20 (10.60%)
Resistance Levels: R1 ₹2,944.50 | R2 ₹2,999.70 | R3 ₹3,083.40
Support Levels: S1 ₹2,805.60 | S2 ₹2,721.90 | S3 ₹2,666.70
Range Structure: Low ₹2,606.80 | High ₹3,083.40
Higher Timeframe Observation Zones: ₹3,000 | ₹3,083 | ₹3,150
________________________________________
MOMENTUM, PARTICIPATION & CPR DATA
Volume Profile: 1.53 Million Shares
Volume Character: Extremely High Relative Participation
RSI: 63.62 (Strong Momentum Zone)
ADX: 10.48 (Early Trend Development)
ROC: +3.21%
MACD Status: Fresh Bullish Crossover
CCI: +198.29 (Strong Bullish Momentum)
Stochastic Reading: 90.01 (Extended Momentum Zone)
Current Bias: BUY ON PULLBACKS
CPR State: Bullish Zone | CPR Moving Up (Narrow)
Today's CPR: Pivot ₹2,777.55 | Top ₹2,776.55 | Base ₹2,778.50
Tomorrow's CPR (Projected): Pivot ₹2,860.80 | Top ₹2,875.05 | Base ₹2,846.55
________________________________________
📚 EDUCATIONAL OBSERVATION
SRF has confirmed a breakout from an Ascending Triangle, a bullish continuation pattern that often develops during an established uptrend. The pattern is characterised by a series of higher lows, indicating increasing buyer aggression, while repeated tests of a relatively flat resistance level gradually absorb selling pressure. The eventual breakout above resistance suggests that buyers have gained control and that the prior uptrend may be ready to resume.
The latest breakout is supported by a strong bullish candle, exceptionally high trading volume and expanding momentum, reflecting broad market participation. Increased volume during a triangle breakout generally strengthens the reliability of the move, as it indicates that the breakout is supported by genuine buying interest rather than low-volume price fluctuations.
Momentum indicators continue to remain constructive. The RSI at 63.62 reflects healthy bullish momentum without reaching extreme overbought territory. MACD has generated a fresh bullish crossover, signalling improving trend strength, while the ROC of +3.21% indicates continued upside acceleration. The CCI reading of +198.29 confirms strong buying momentum, and the Stochastic reading of 90.01 reflects sustained participation, although elevated momentum readings may occasionally lead to short-term consolidations.
The projected Central Pivot Range (CPR) for the next trading session has shifted higher, with the projected Pivot at ₹2,860.80. A rising CPR generally indicates improving market acceptance of higher prices and often supports trend continuation when accompanied by strong participation. The dashboard therefore continues to maintain a Buy on Pullbacks approach rather than chasing prices after a sharp advance.
The immediate technical focus remains on the resistance zone between ₹2,945 and ₹3,000. Sustained trading above this region could reinforce the breakout and bring the higher-timeframe observation zones near ₹3,083 and ₹3,150 into focus. On the downside, ₹2,806 remains the first important support, while the structural invalidation level is positioned near ₹2,607.
________________________________________
🏢 BUSINESS OVERVIEW
SRF Limited is a diversified chemicals and manufacturing company with businesses spanning specialty chemicals, fluorochemicals, packaging films and technical textiles. The company continues to benefit from increasing global demand for specialty chemicals, expanding export opportunities and ongoing capacity additions across its high-margin businesses. Its diversified product portfolio and focus on innovation provide a constructive long-term business outlook.
________________________________________
📖 Educational Note
Support and resistance levels should be treated as observation zones rather than predictive targets. Chart patterns, price action, volume analysis, momentum indicators and CPR are educational tools that help market participants understand evolving market structure within a disciplined risk-management framework.
________________________________________
⚠️ Disclaimer
This analysis is provided strictly for educational and informational purposes.
It does not constitute financial, investment or trading advice and should not be interpreted as a recommendation to buy or sell any security.
Investments in the stock market are subject to market risks, including the possible loss of capital.
Historical performance, chart patterns and technical indicators do not guarantee future results.
Please conduct your own research and consult a SEBI-registered investment adviser before making investment decisions.
STWP assumes no responsibility or liability for any financial loss arising directly or indirectly from the use of this analysis.

STWP | Mentor & Demand-Supply Specialist |
Empowering traders through structured learning |
simpletradewithpatience.com
chat.whatsapp.com/CpgyHCfioQ5Hxf7rd8pDqw
wa.me/message/6IOPHGOXMGZ4N1
Educational Only
Empowering traders through structured learning |
simpletradewithpatience.com
chat.whatsapp.com/CpgyHCfioQ5Hxf7rd8pDqw
wa.me/message/6IOPHGOXMGZ4N1
Educational Only
Disclaimer
The information and publications are not meant to be, and do not constitute, financial, investment, trading, or other types of advice or recommendations supplied or endorsed by TradingView. Read more in the Terms of Use.
STWP | Mentor & Demand-Supply Specialist |
Empowering traders through structured learning |
simpletradewithpatience.com
chat.whatsapp.com/CpgyHCfioQ5Hxf7rd8pDqw
wa.me/message/6IOPHGOXMGZ4N1
Educational Only
Empowering traders through structured learning |
simpletradewithpatience.com
chat.whatsapp.com/CpgyHCfioQ5Hxf7rd8pDqw
wa.me/message/6IOPHGOXMGZ4N1
Educational Only
Disclaimer
The information and publications are not meant to be, and do not constitute, financial, investment, trading, or other types of advice or recommendations supplied or endorsed by TradingView. Read more in the Terms of Use.