
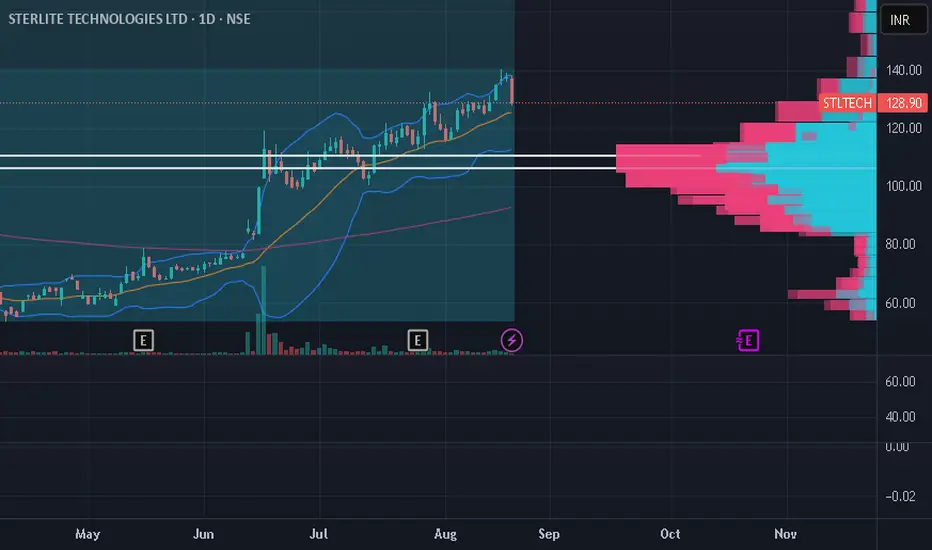
## Carborundum Universal Share Price Action Analysis & Fundamental Review### **Price Action Analysis**Carborundum Universal exhibited a dramatic **technical breakout** on August 20, 2025, with the stock surging **13.82%** to close at **₹990.25** from the previous day's close of ₹870.05. This represented the highest single-day gain in the recent period, accompanied by exceptional trading volumes of **4.78 million shares**—significantly higher than the typical daily average.[1][2]**Key Technical Observations:**
- **Consolidation Phase**: The stock traded in a narrow range between ₹833-885 from August 7-19, forming a strong base[2]
- **Breakout Pattern**: The August 20 surge broke through multiple resistance levels with strong volume confirmation[1][3]
- **Volatility Range**: Over the past month, the stock ranged from a low of ₹833.05 to a high of ₹1,018.00, indicating high volatility of **18.6%**[2]
- **Moving Average Signals**: Both 10-day and 50-day moving average crossovers appeared, historically indicating average gains of 4-6% within 7-30 days[1]
### **Fundamental Analysis****Financial Health Overview:**
Carborundum Universal demonstrates **strong balance sheet fundamentals** but faces **profitability challenges** in the recent quarter.[4][5]
#### **ROCE & ROE Analysis**
| **Metric** | **Mar 2025** | **Mar 2024** | **Change** | **5-Year Trend** |
|------------|--------------|--------------|------------|------------------|
| **ROE** | 9.06% | 16.14% | **-43.87%** | Declining from 17.16% peak |
| **ROCE** | 14.00% | 21.28% | **-34.21%** | Down from 21.47% in 2023 |
**ROE Analysis:**
- Current ROE of **9.06%** is significantly below the industry benchmark and the company's historical performance[6][7]
- The sharp decline from 16.14% to 9.06% reflects **reduced profitability** relative to shareholder equity[7]
- The 5-year average ROE of **14.6%** suggests the current level is temporarily depressed[7]
**ROCE Analysis:**
- ROCE dropped to **14.00%** from a consistent **20%+ range** maintained over 2021-2024[6]
- This indicates **declining efficiency** in generating profits from capital employed[6]
- Despite the decline, 14% ROCE still represents reasonable capital efficiency compared to risk-free returns[6]
#### **Key Financial Strengths**
**Balance Sheet Quality:**
- **Debt-to-Equity Ratio**: Excellent at **0.03x**, down from 0.04x, indicating virtually **debt-free operations**[8][9]
- **Current Ratio**: Strong liquidity at **3.64x**, improved from 3.41x[10]
- **Cash Position**: Robust free cash flow generation at **98% of PAT** at consolidated level[11]
**Operational Metrics:**
- **Revenue Growth**: Modest **1.79% YoY** growth in Q1 FY26 to ₹1,238 crores[12]
- **Segment Performance**: Ceramics (+11.1%) and Electrominerals (+6.3%) showed growth, while Abrasives declined (-8%)[13][12]
- **Market Position**: Leadership across abrasives, ceramics, and electrominerals with strong brand presence[12]
#### **Key Concerns**
**Profitability Pressure:**
- **Net Profit**: Declined **47.4% YoY** to ₹60 crores in Q1 FY26[13][12]
- **Operating Margin**: Compressed to **6.55%** from 12.38% in previous year[1][13]
- **Cost Inflation**: Total expenses surged **9.64% YoY** due to raw material and energy cost pressures[12][13]
**Valuation Concerns:**
- **PE Ratio**: High at **68.56x**, indicating expensive valuation relative to earnings[14][1]
- **PB Ratio**: Premium at **4.51x** compared to book value[15]
- **Trading Premium**: Currently trading at **29% premium** to intrinsic value estimates[4]
### **Investment Outlook****Short-term Prospects:**
The technical breakout suggests **bullish momentum** could continue, with immediate resistance at ₹1,018 and support around ₹870-885. However, investors should be cautious of **profit-taking** after the sharp surge.[1][2]
**Medium-term Fundamentals:**
While the balance sheet remains strong with minimal debt, the **deteriorating profitability metrics** and **margin compression** are concerning. Management's focus on **cost optimization** and **operational efficiencies** will be crucial for recovery.[12]
**Risk Factors:**
- High valuation multiples leave little margin for error
- Continued cost inflation pressure on margins
- Dependence on cyclical industrial demand
**Conclusion:**
Carborundum Universal presents a **mixed investment proposition**—technically attractive with strong balance sheet fundamentals, but challenged by declining profitability and high valuations. The recent breakout may offer trading opportunities, but long-term investors should monitor the company's ability to restore margin health and improve capital efficiency before making significant commitments.
[1] economictimes.indiatimes.com/carborundum-universal-ltd/stocks/companyid-13909.cms
[2] equitypandit.com/historical-data/CARBORUNIV
[3] in.tradingview.com/symbols/NSE-CARBORUNIV/
[4] smart-investing.in/main.php?Company=CARBORUNDUM+UNIVERSAL+LTD
[5] screener.in/company/CARBORUNIV/consolidated/
[6] smart-investing.in/financial-ratios.php?Company=CARBORUNDUM+UNIVERSAL+LTD&p=ROCE
[7] smart-investing.in/financial-ratios.php?Company=CARBORUNDUM+UNIVERSAL+LTD&p=ROE
[8] smart-investing.in/financial-ratios.php?Company=CARBORUNDUM+UNIVERSAL+LTD&p=Total+Debt/Equity
[9] cumi-murugappa.com/wp-content/uploads/2025/08/Q1-FY-2025-26-Earnings-Call-Transcript-1.pdf
[10] moneycontrol.com/financials/carborundumuniversal/ratiosVI/cu
[11] ca.finance.yahoo.com/news/carborundum-universal-ltd-bom-513375-070241856.html
[12] alphastreet.com/india/carborundum-universal-q1-fy26-earnings-results/
[13] business-standard.com/markets/capital-market-news/carborundum-universal-drops-after-q1-pat-slides-45-yoy-to-rs-62-cr-125080700978_1.html
[14] smart-investing.in/pe-ratio.php?Company=CARBORUNDUM+UNIVERSAL+LTD
[15] moneycontrol.com/india/stockpricequote/abrasives/carborundumuniversal/CU
[16] perplexity.ai/finance/CARBORUNIV.BO
[17] tourismjk.in/forecast2025/Carborundum-Universal-Limited-(513375)-Stock-Experiences-Sudden-Dip
[18] nseindia.com/get-quotes/equity?symbol=CARBORUNIV
[19] simplywall.st/stocks/in/materials/nse-carboruniv/carborundum-universal-shares/future
[20] finance.yahoo.com/quote/CARBORUNIV.NS/history/
[21] kotaksecurities.com/financial-results/carborundum-universal-ltd-q1fy2025-26-results/
[22] icicidirect.com/stocks/carborundum-universal-ltd-share-price
[23] choiceindia.com/stocks/carborundum-universal-ltd-share-price-history
[24] psms.bits-pilani.ac.in/key-takeaways/Is-Carborundum-Universal-Limited-Stock-Poised-for-a-Breakout-in-2025
[25] tourismjk.in/technicalanalysis/Carborundum-Universal-Limited-(CARBORUNIV)-Stock-Rallies
[26] goodreturns.in/company/carborundum-universal/ratios.html
[27] ppl-ai-code-interpreter-files.s3.amazonaws.com/web/direct-files/0cc3a9ac853366be4771f25e74ea5553/e4839cc5-17b4-4a1a-a723-d8402a11e504/7bd86297.csv
[28] ppl-ai-code-interpreter-files.s3.amazonaws.com/web/direct-files/0cc3a9ac853366be4771f25e74ea5553/d4717c6e-53ff-4b85-9a74-3f56fd7585b1/969447a5.csv
[29] ppl-ai-code-interpreter-files.s3.amazonaws.com/web/direct-files/0cc3a9ac853366be4771f25e74ea5553/d4717c6e-53ff-4b85-9a74-3f56fd7585b1/e8b2f04b.csv

Disclaimer
The information and publications are not meant to be, and do not constitute, financial, investment, trading, or other types of advice or recommendations supplied or endorsed by TradingView. Read more in the Terms of Use.
Disclaimer
The information and publications are not meant to be, and do not constitute, financial, investment, trading, or other types of advice or recommendations supplied or endorsed by TradingView. Read more in the Terms of Use.