
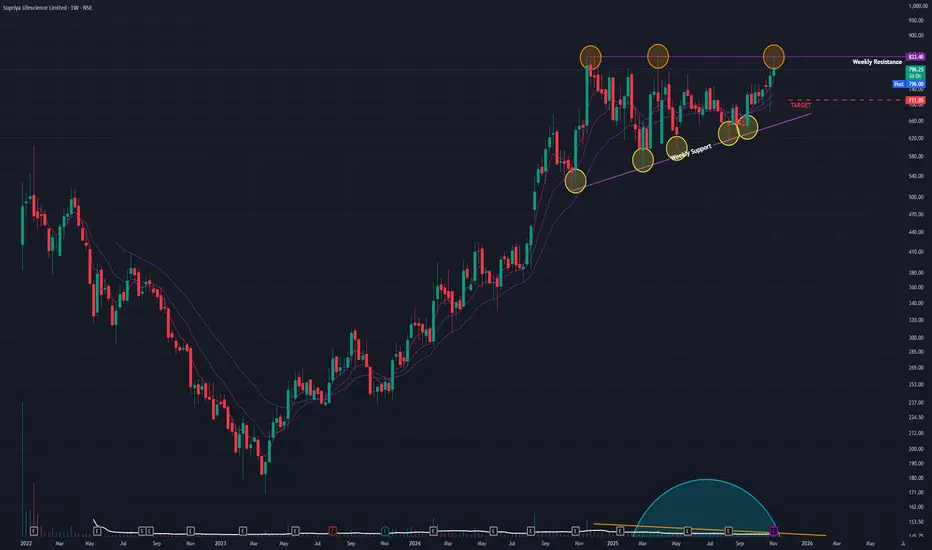
The stock is in a classic bullish consolidation pattern. After establishing a major bottom in March 2023, the price has been in a clear uptrend. The current "Ascending Triangle" pattern shows that pressure is building for a significant move.
📈 1. The Dominant Pattern: Ascending Triangle
- Formation: Since October 2024, the stock has been forming a clear Ascending Triangle. This is defined by:
1. A flat, horizontal resistance line that has rejected multiple breakout attempts.
2. A rising support trendline, indicating that buyers are stepping in at progressively higher prices.
- Implication: This pattern is bullish because it shows that sellers are holding a fixed line, but buyer aggression is steadily increasing.
🚀 2. The Current Setup (The "Coiling Spring")
- Pressure Building: The stock has made several attempts to break the resistance and failed. This is normal and builds energy for the eventual move.
- Imminent Test: The stock is once again testing this critical resistance this week. The price is being compressed between the rising support and the flat resistance, which usually precedes a volatile move.
📊 3. Key Technical Indicators
- RSI: The Relative Strength Index is rising on both the Monthly and Weekly timeframes. This shows that long-term and medium-term momentum is building in favor of the buyers.
- EMAs: The short-term Exponential Moving Averages are in a "PCO" (Price Crossover) state, confirming the immediate trend is bullish.
🎯 4. Future Scenarios & Key Levels to Watch
This setup provides two very clear outcomes:
🐂 The Bullish Case (Breakout)
- Trigger: A decisive, high-volume close above the horizontal resistance of the triangle.
- Confirmation: This move would confirm the triangle is complete and the next leg of the uptrend has begun.
- Target: The next logical price target would be ₹1,300.
🐻 The Bearish Case (Breakdown)
- Trigger: The stock fails at resistance again and, more importantly, breaks below the triangle's rising support trendline.
- Confirmation: This would invalidate the bullish pattern.
- Target: The price would likely fall to retest the next major horizontal support level at ₹710.
📈 1. The Dominant Pattern: Ascending Triangle
- Formation: Since October 2024, the stock has been forming a clear Ascending Triangle. This is defined by:
1. A flat, horizontal resistance line that has rejected multiple breakout attempts.
2. A rising support trendline, indicating that buyers are stepping in at progressively higher prices.
- Implication: This pattern is bullish because it shows that sellers are holding a fixed line, but buyer aggression is steadily increasing.
🚀 2. The Current Setup (The "Coiling Spring")
- Pressure Building: The stock has made several attempts to break the resistance and failed. This is normal and builds energy for the eventual move.
- Imminent Test: The stock is once again testing this critical resistance this week. The price is being compressed between the rising support and the flat resistance, which usually precedes a volatile move.
📊 3. Key Technical Indicators
- RSI: The Relative Strength Index is rising on both the Monthly and Weekly timeframes. This shows that long-term and medium-term momentum is building in favor of the buyers.
- EMAs: The short-term Exponential Moving Averages are in a "PCO" (Price Crossover) state, confirming the immediate trend is bullish.
🎯 4. Future Scenarios & Key Levels to Watch
This setup provides two very clear outcomes:
🐂 The Bullish Case (Breakout)
- Trigger: A decisive, high-volume close above the horizontal resistance of the triangle.
- Confirmation: This move would confirm the triangle is complete and the next leg of the uptrend has begun.
- Target: The next logical price target would be ₹1,300.
🐻 The Bearish Case (Breakdown)
- Trigger: The stock fails at resistance again and, more importantly, breaks below the triangle's rising support trendline.
- Confirmation: This would invalidate the bullish pattern.
- Target: The price would likely fall to retest the next major horizontal support level at ₹710.

Disclaimer
The information and publications are not meant to be, and do not constitute, financial, investment, trading, or other types of advice or recommendations supplied or endorsed by TradingView. Read more in the Terms of Use.
Disclaimer
The information and publications are not meant to be, and do not constitute, financial, investment, trading, or other types of advice or recommendations supplied or endorsed by TradingView. Read more in the Terms of Use.