
1. The Macro Perspective: The Structural Breakout
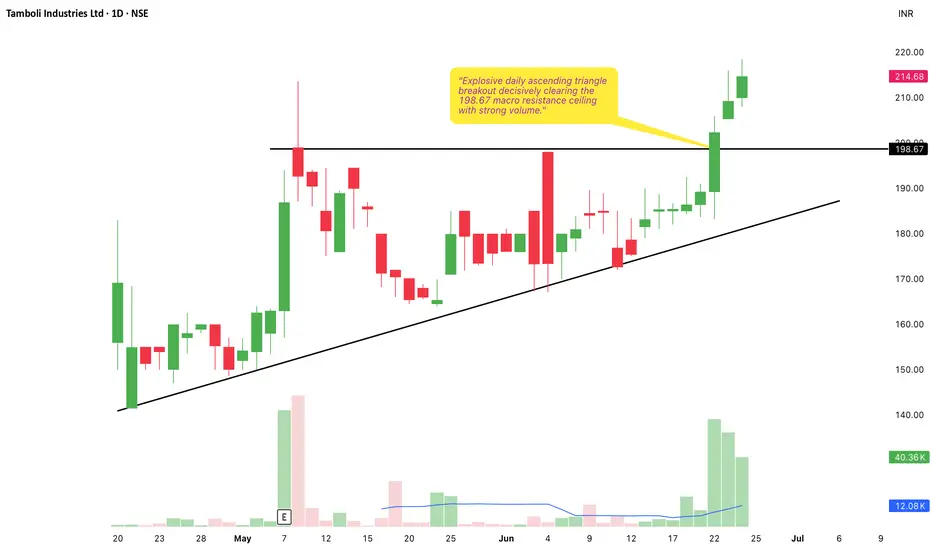
I am taking a LONG bias on Tamboli Industries Ltd (TAMBOLIIN) on the daily (1D) timeframe. Following a period of volatility earlier in the year, the stock entered a highly constructive digestion phase. By continuously printing higher lows against a fixed horizontal resistance over the past two months, the stock carved out a high-precision ascending triangle pattern. This structure is a classic footprint of institutional accumulation; buyers were willing to step in at progressively higher prices, coiling the spring tightly before unleashing this week's highly aggressive markup phase.
2. The Educational Setup: Defining the Boundaries
To understand the technical validity behind this macro launch, look closely at how the price structure interacted with its core boundaries:
The 198.67 Upper Resistance: The definitive ceiling for a bullish structural shift was the black horizontal resistance line marked strictly at 198.67. This level acted as a major supply zone that capped the previous prominent peaks in early May and early June.
The Ascending Support Trendline: Complementing the resistance was a firm upward-sloping trendline connecting the higher lows since late April. This rising floor continuously compressed the price action against the 198.67 ceiling, building immense structural pressure.
3. Current Price Action: Breakout and Volume Expansion
The structural pressure cooker has officially exploded. Looking at the far right of the chart, buyers have stepped in with overwhelming conviction, supported by a significant expansion in daily trading volume that towers over the preceding consolidation phase. The stock printed a series of powerful green expansion candles that decisively obliterated the 198.67 macro ceiling. It is showing excellent continuation and is currently trading exceptionally strong at 214.68. The stock has officially transitioned out of accumulation and into a highly explosive, momentum-driven markup trend.
4. The Trade Plan: Entries, Targets, and Risk Management
Entry Strategy: Momentum is currently extreme. Chasing extended daily expansion candles carries a significant risk of a rapid lower-timeframe mean-reversion pullback. The highest-probability entry strategy is to exercise patience and look to scale into long positions on a potential structural pullback to retest the broken 195.00 to 200.00 prior resistance zone. Letting old historical resistance prove itself as a concrete new support floor provides an unmatched risk-to-reward ratio.
Targets: By utilizing a classical measured move strategy based on the maximum structural depth of the triangle base (measuring from the deep lows near 145.00 up to the 198.67 ceiling), we can project an expansion of roughly 50+ points. Projecting this upward from the breakout point, our primary short-term structural target sits comfortably in the 245.00 to 255.00 zone.
Risk Management: An explosive continuation breakout thesis is invalidated if the price fails to hold the breakout and collapses back deep inside the triangle pattern, breaking the ascending trendline. A hard stop loss should be placed safely below the recent minor swing low structure just prior to the breakout, specifically around the 180.00 to 185.00 level.
5. Time Horizon:
Because this technical setup captures a highly explosive momentum breakout and a textbook ascending triangle completion on the 1-Day chart, this is a swing-to-position trade designed to capture a rapid, sustained markup phase. Trail your stop losses tightly as it runs!
I am taking a LONG bias on Tamboli Industries Ltd (TAMBOLIIN) on the daily (1D) timeframe. Following a period of volatility earlier in the year, the stock entered a highly constructive digestion phase. By continuously printing higher lows against a fixed horizontal resistance over the past two months, the stock carved out a high-precision ascending triangle pattern. This structure is a classic footprint of institutional accumulation; buyers were willing to step in at progressively higher prices, coiling the spring tightly before unleashing this week's highly aggressive markup phase.
2. The Educational Setup: Defining the Boundaries
To understand the technical validity behind this macro launch, look closely at how the price structure interacted with its core boundaries:
The 198.67 Upper Resistance: The definitive ceiling for a bullish structural shift was the black horizontal resistance line marked strictly at 198.67. This level acted as a major supply zone that capped the previous prominent peaks in early May and early June.
The Ascending Support Trendline: Complementing the resistance was a firm upward-sloping trendline connecting the higher lows since late April. This rising floor continuously compressed the price action against the 198.67 ceiling, building immense structural pressure.
3. Current Price Action: Breakout and Volume Expansion
The structural pressure cooker has officially exploded. Looking at the far right of the chart, buyers have stepped in with overwhelming conviction, supported by a significant expansion in daily trading volume that towers over the preceding consolidation phase. The stock printed a series of powerful green expansion candles that decisively obliterated the 198.67 macro ceiling. It is showing excellent continuation and is currently trading exceptionally strong at 214.68. The stock has officially transitioned out of accumulation and into a highly explosive, momentum-driven markup trend.
4. The Trade Plan: Entries, Targets, and Risk Management
Entry Strategy: Momentum is currently extreme. Chasing extended daily expansion candles carries a significant risk of a rapid lower-timeframe mean-reversion pullback. The highest-probability entry strategy is to exercise patience and look to scale into long positions on a potential structural pullback to retest the broken 195.00 to 200.00 prior resistance zone. Letting old historical resistance prove itself as a concrete new support floor provides an unmatched risk-to-reward ratio.
Targets: By utilizing a classical measured move strategy based on the maximum structural depth of the triangle base (measuring from the deep lows near 145.00 up to the 198.67 ceiling), we can project an expansion of roughly 50+ points. Projecting this upward from the breakout point, our primary short-term structural target sits comfortably in the 245.00 to 255.00 zone.
Risk Management: An explosive continuation breakout thesis is invalidated if the price fails to hold the breakout and collapses back deep inside the triangle pattern, breaking the ascending trendline. A hard stop loss should be placed safely below the recent minor swing low structure just prior to the breakout, specifically around the 180.00 to 185.00 level.
5. Time Horizon:
Because this technical setup captures a highly explosive momentum breakout and a textbook ascending triangle completion on the 1-Day chart, this is a swing-to-position trade designed to capture a rapid, sustained markup phase. Trail your stop losses tightly as it runs!

Disclaimer
The information and publications are not meant to be, and do not constitute, financial, investment, trading, or other types of advice or recommendations supplied or endorsed by TradingView. Read more in the Terms of Use.
Disclaimer
The information and publications are not meant to be, and do not constitute, financial, investment, trading, or other types of advice or recommendations supplied or endorsed by TradingView. Read more in the Terms of Use.