
A breakdown does not always mean the structure has failed.
Sometimes, where the breakdown happens matters more than the breakdown itself.
This historical Tata Chemicals chart is a good example.
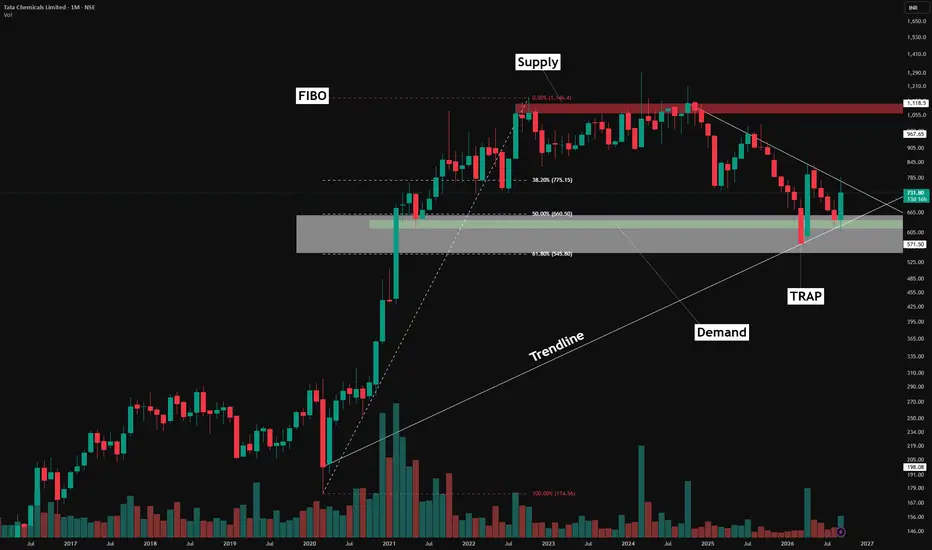
After a strong expansion, Fibonacci retracement is drawn across the larger move. This highlights an important retracement area between the 50% and 61.8% levels — marked by the white zone on the chart.
This area is often watched as a Fibonacci retracement confluence zone, with 61.8% being the classic Fibonacci ratio and 50% commonly included by traders despite not itself being a Fibonacci ratio.
Now add another layer.
Price is broadly moving between the marked Supply and Demand zones, creating a larger sideways structure. During the decline from supply, price eventually pushes beneath the green demand area.
At first glance, that breakdown looks important.
But notice where it occurs.
The move below demand runs directly into the broader 50%–61.8% retracement zone. Instead of treating the green demand zone in isolation, the chart shows why multiple technical references can matter at the same location.
The apparent breakdown therefore becomes an excellent example of a failed breakdown / trap within the historical structure.
And there is still another structure hidden in the chart.
The descending counter-trendline from the highs and the larger rising trendline gradually converge, creating the geometry of a symmetrical triangle.
So one chart contains several interconnected concepts:
Supply & Demand → Fibonacci Retracement → Failed Breakdown → Trendline Confluence → Symmetrical Triangle
That is the bigger lesson.
Technical analysis becomes far more interesting when we stop looking at individual tools in isolation and start studying confluence — where different structures tell us something about the same area of the chart.
Historical chart older than 3 months shared for educational purposes only. This post discusses technical-analysis concepts and does not represent a current market view or recommendation.
Sometimes, where the breakdown happens matters more than the breakdown itself.
This historical Tata Chemicals chart is a good example.
After a strong expansion, Fibonacci retracement is drawn across the larger move. This highlights an important retracement area between the 50% and 61.8% levels — marked by the white zone on the chart.
This area is often watched as a Fibonacci retracement confluence zone, with 61.8% being the classic Fibonacci ratio and 50% commonly included by traders despite not itself being a Fibonacci ratio.
Now add another layer.
Price is broadly moving between the marked Supply and Demand zones, creating a larger sideways structure. During the decline from supply, price eventually pushes beneath the green demand area.
At first glance, that breakdown looks important.
But notice where it occurs.
The move below demand runs directly into the broader 50%–61.8% retracement zone. Instead of treating the green demand zone in isolation, the chart shows why multiple technical references can matter at the same location.
The apparent breakdown therefore becomes an excellent example of a failed breakdown / trap within the historical structure.
And there is still another structure hidden in the chart.
The descending counter-trendline from the highs and the larger rising trendline gradually converge, creating the geometry of a symmetrical triangle.
So one chart contains several interconnected concepts:
Supply & Demand → Fibonacci Retracement → Failed Breakdown → Trendline Confluence → Symmetrical Triangle
That is the bigger lesson.
Technical analysis becomes far more interesting when we stop looking at individual tools in isolation and start studying confluence — where different structures tell us something about the same area of the chart.
Historical chart older than 3 months shared for educational purposes only. This post discusses technical-analysis concepts and does not represent a current market view or recommendation.

📊Swing & positional research with Buy, Sell & Hold recommendations
Contact for NOVEMBER SLOTS
📞WhatsApp ( Pro ): wa.me/919455664601
📢Free Picks on Telegram ( Join ) : t.me/hashtaghammer
Apoorv Dubey|SEBI RA INH000030287
Contact for NOVEMBER SLOTS
📞WhatsApp ( Pro ): wa.me/919455664601
📢Free Picks on Telegram ( Join ) : t.me/hashtaghammer
Apoorv Dubey|SEBI RA INH000030287
Related publications
Disclaimer
The information and publications are not meant to be, and do not constitute, financial, investment, trading, or other types of advice or recommendations supplied or endorsed by TradingView. Read more in the Terms of Use.
📊Swing & positional research with Buy, Sell & Hold recommendations
Contact for NOVEMBER SLOTS
📞WhatsApp ( Pro ): wa.me/919455664601
📢Free Picks on Telegram ( Join ) : t.me/hashtaghammer
Apoorv Dubey|SEBI RA INH000030287
Contact for NOVEMBER SLOTS
📞WhatsApp ( Pro ): wa.me/919455664601
📢Free Picks on Telegram ( Join ) : t.me/hashtaghammer
Apoorv Dubey|SEBI RA INH000030287
Related publications
Disclaimer
The information and publications are not meant to be, and do not constitute, financial, investment, trading, or other types of advice or recommendations supplied or endorsed by TradingView. Read more in the Terms of Use.