 TATAELXSI
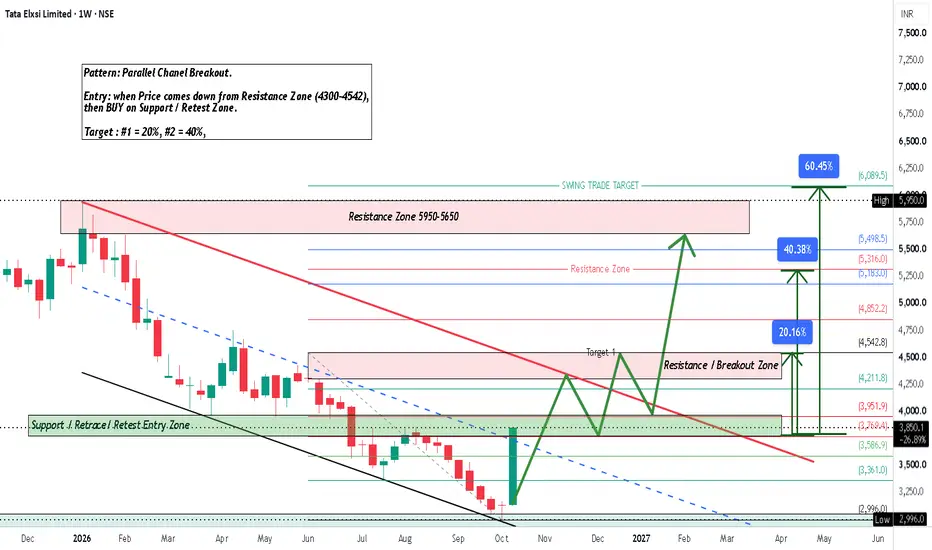
Tata Elxsi Limited is forming a potential multi-month turnaround setup on the weekly chart following an extended corrective phase from its peak near ₹5,950.00. The stock recently tested a structural base low at ₹2,996.00 along the lower boundary of a long-term **Parallel Channel Breakout** structure. Currently trading at ₹3,850.10 (+23.01%), price is rebounding sharply inside the Support / Retrace / Retest Entry Zone (₹3,586.90 – ₹3,951.90). According to the chart plan: "Entry: when Price comes down from Resistance Zone (4300–4542), then BUY on Support / Retest Zone."
🔹 PATTERN: PARALLEL CHANNEL BREAKOUT & RETEST SUPPORT
• Parallel Channel Structure: A multi-month descending parallel channel bounded by an upper red diagonal resistance line and a lower black channel floor.
• Support / Retrace / Retest Entry Zone: Green horizontal demand box spanning ₹3,586.90 – ₹3,951.90 (with key level at ₹3,769.40).
• Intermediate Resistance / Breakout Zone: Red horizontal supply box (₹4,211.80 – ₹4,542.80) marking Target #1 and the pullback trigger zone.
• Major Resistance Zone: Overhead supply block situated between ₹5,650.00 and ₹5,950.00.
• Structural Low Floor: Base demand support near ₹2,996.00 (52-week Low).
🟢 UPSIDE SCENARIO – BULLISH BREAKOUT
• Retest / Retrace BUY Entry Level: ₹3,769.40 (BUY on Support / Retest Zone)
• Confirmation Required: Weekly candle holding support around ₹3,769.40 – ₹3,951.90
• TARGET #1 (Intermediate Resistance): ₹4,530.00 (+20.16% move from ₹3,769.40 BUY entry)
• TARGET #2 (Upper Resistance Level): ₹5,291.50 (+40.38% move from BUY entry)
• SWING TRADE TARGET / Major Resistance: ₹6,048.00 – ₹6,089.50 (+60.45% move from BUY entry)
🔴 DOWNSIDE SCENARIO – BEARISH BREAKDOWN
• Weakening Level: Rejection near ₹4,211.80 – ₹4,542.80 followed by loss of ₹3,586.90
• Breakdown Level: Below ₹3,361.00 toward lower channel support
• Important Support Levels: ₹3,951.90, ₹3,769.40 (Retest BUY), ₹3,586.90, ₹3,361.00, and ₹2,996.00 (Major Base Low)
• Invalidation / Stop Loss (SL): Weekly candle close below ₹2,996.00 (-20.51% SL from ₹3,769.40 BUY entry) or below retest zone support at ₹3,586.90 (-4.84% SL).
🔹 MY BREAKOUT & EXIT RULE
If price crosses above a key resistance level (such as ₹4,542.80, ₹5,183.00, or ₹5,650.00) and makes a High above that level, but closes below that same level, I consider it a failed breakout/rejection and the BUYER NEEDS TO EXIT THE TRADE.
High above level + Close below level = Failed breakout → EXIT BUY TRADE.
🎯 MY TRADE ROADMAP
Bullish Breakout Path:
Initial Rally toward Resistance Zone (₹4,300.00 – ₹4,542.80)
↓
Pullback / Retrace to Support Zone at ₹3,769.40 (BUY Entry)
↓
₹4,530.00 TARGET #1 (+20.16% from BUY Entry)
↓
₹5,291.50 TARGET #2 (+40.38% from BUY Entry)
↓
₹6,048.00 – ₹6,089.50 SWING TRADE TARGET (+60.45% from BUY Entry)
Bearish Breakdown Path:
Rejection at Resistance Zone (₹4,300.00 – ₹4,542.80)
↓
Failure to hold ₹3,769.40 / ₹3,586.90 Retest Support
↓
₹3,361.00 Intermediate Lower Support
↓
₹2,996.00 Major Base Low Invalidation (-20.51% SL from BUY Entry)
🔑 MY VIEW
The preferred setup is a structured swing trade plan, waiting for price to retrace and build a firm higher-low support inside the ₹3,586.90 – ₹3,951.90 zone (around ₹3,769.40 BUY entry) after initial resistance testing. The recovery off the channel bottom near ₹2,996.00 indicates strong long-term accumulation.
The bullish expansion thesis activates upon holding the retest support at ₹3,769.40 (BUY Entry) and breaking above ₹4,542.80, paving the way toward ₹4,530.00 (TARGET #1 / +20.16%), ₹5,291.50 (TARGET #2 / +40.38%), and the SWING TRADE TARGET at ₹6,048.00 – ₹6,089.50 (+60.45% from BUY Entry). The setup invalidates if price fails to hold the retest shelf at ₹3,586.90 or breaks down below the 52-week low at ₹2,996.00. A breakout confirmation requires a proper weekly candle close above key trigger levels, strictly following the candle-close exit rule if a rejection occurs.
---
This is technical analysis based on chart structure, price levels, and visual patterns shown above. It is not financial advice. Market conditions can change and actual price movement may differ from projected levels.

Disclaimer
The information and publications are not meant to be, and do not constitute, financial, investment, trading, or other types of advice or recommendations supplied or endorsed by TradingView. Read more in the Terms of Use.
Disclaimer
The information and publications are not meant to be, and do not constitute, financial, investment, trading, or other types of advice or recommendations supplied or endorsed by TradingView. Read more in the Terms of Use.