
📊
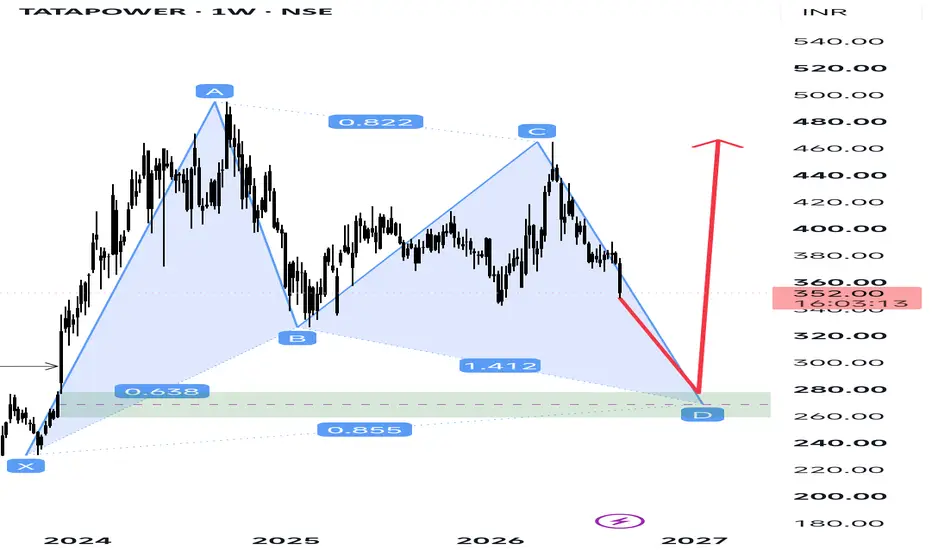
The chart shows a potential bullish harmonic reversal setup developing on the weekly timeframe, with the key PRZ (Potential Reversal Zone) around ₹260–₹280.
Pattern structure:
X → A: Strong bullish impulse from approximately ₹230 to ₹495.
A → B: Deep corrective move, with the AB retracement marked around 0.638.
B → C: Recovery toward ₹465, with the BC ratio around 0.822.
C → D: Current decline is projected toward the ₹260–₹280 PRZ, with the CD extension shown around 1.412.
The convergence of these Fibonacci relationships makes ₹260–₹280 an important reaction zone.
🔑 PRZ: ₹260–₹280
This is the most important area on the chart.
If price reaches this zone and produces a bullish reversal structure, it could provide confirmation that point D has formed.
Possible confirmation signals:
Bullish rejection candle on the weekly timeframe
Bullish engulfing / strong demand candle
Break of the previous week's high
Lower-timeframe BOS + FVG
Increasing volume during the reversal
🎯 Potential upside
If D holds and the reversal is confirmed, the first major resistance areas are:
₹320 → ₹360 → ₹400 → ₹440 → ₹465
A sustained move above ₹465 would significantly strengthen the bullish structure and open the possibility of a move toward the ₹500+ region.
⚠️ Important
The red projection is a potential path, not a guaranteed target. The harmonic setup is valid only if the PRZ produces a meaningful reversal. A decisive weekly breakdown below the ₹260–₹280 zone would weaken/invalidate the bullish thesis.
The chart shows a potential bullish harmonic reversal setup developing on the weekly timeframe, with the key PRZ (Potential Reversal Zone) around ₹260–₹280.
Pattern structure:
X → A: Strong bullish impulse from approximately ₹230 to ₹495.
A → B: Deep corrective move, with the AB retracement marked around 0.638.
B → C: Recovery toward ₹465, with the BC ratio around 0.822.
C → D: Current decline is projected toward the ₹260–₹280 PRZ, with the CD extension shown around 1.412.
The convergence of these Fibonacci relationships makes ₹260–₹280 an important reaction zone.
🔑 PRZ: ₹260–₹280
This is the most important area on the chart.
If price reaches this zone and produces a bullish reversal structure, it could provide confirmation that point D has formed.
Possible confirmation signals:
Bullish rejection candle on the weekly timeframe
Bullish engulfing / strong demand candle
Break of the previous week's high
Lower-timeframe BOS + FVG
Increasing volume during the reversal
🎯 Potential upside
If D holds and the reversal is confirmed, the first major resistance areas are:
₹320 → ₹360 → ₹400 → ₹440 → ₹465
A sustained move above ₹465 would significantly strengthen the bullish structure and open the possibility of a move toward the ₹500+ region.
⚠️ Important
The red projection is a potential path, not a guaranteed target. The harmonic setup is valid only if the PRZ produces a meaningful reversal. A decisive weekly breakdown below the ₹260–₹280 zone would weaken/invalidate the bullish thesis.

Disclaimer
The information and publications are not meant to be, and do not constitute, financial, investment, trading, or other types of advice or recommendations supplied or endorsed by TradingView. Read more in the Terms of Use.
Disclaimer
The information and publications are not meant to be, and do not constitute, financial, investment, trading, or other types of advice or recommendations supplied or endorsed by TradingView. Read more in the Terms of Use.