
1. The Macro Perspective: The Perfect Staircase
I am taking a LONG bias on Tata Steel Limited (TATASTEEL) on the daily (1D) timeframe.
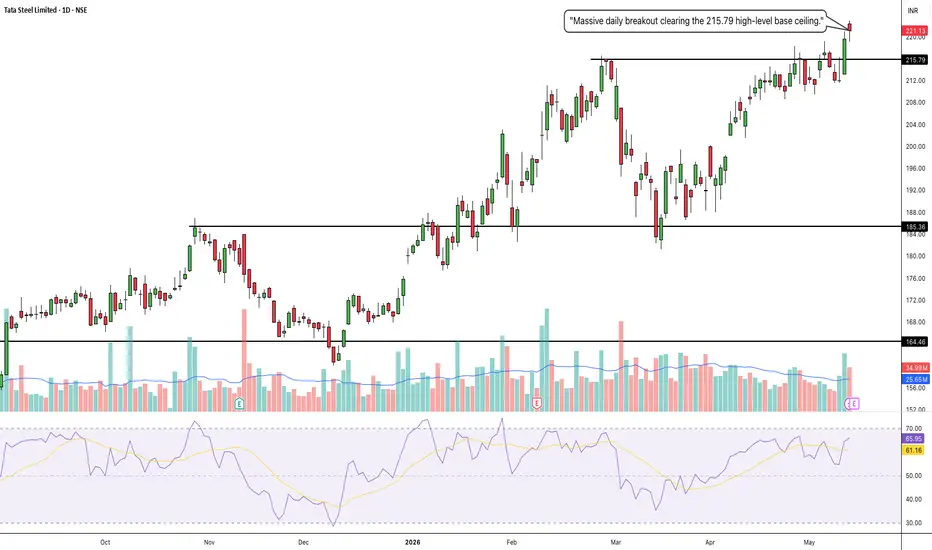
When analyzing pure market structure, the healthiest and most sustainable trends do not go straight up in a single volatile line; they climb stairs. Look at the beautiful structural development on this chart. The stock established a rock-solid floor at the 164.46 line. From there, it rallied to the 185.36 line, paused to build a base, broke out, and used that 185 zone as a higher launchpad. This is textbook institutional behavior—systematically absorbing supply and stepping the price higher to prevent catastrophic pullbacks.
2. The Educational Setup: The Pressure Cooker Handle
To understand the sheer strength of this current breakout, look at how the price behaved after reaching the ultimate resistance ceiling at the solid black 215.79 line:
The Washout and Retest: After hitting 215.79, the stock suffered a healthy corrective pullback. Notice where it stopped? Exactly at the dashed 182.31 / solid 185.36 zone. It perfectly retested its previous structural stepping stone, confirming that old resistance had officially become indestructible support. This formed a massive "Cup" structure.
The High-Level Squeeze: As the price marched back up to the 215.79 ceiling, it didn't just smash into it and fail. It consolidated tightly directly underneath it, forming a "Handle." Consolidating right below major historical resistance acts like a pressure cooker, gracefully transferring shares from impatient retail traders to strong-handed institutional buyers and storing immense kinetic energy.
3. Current Price Action: The Lid Blows Off
Look at the most recent daily candles on the far right. The high-level pressure cooker has exploded. Buyers have effortlessly shattered the 215.79 macro ceiling with a strong momentum thrust, pushing the price past 220. Furthermore, look at the RSI indicator at the bottom of the chart. The RSI has smoothly broken out of its own consolidation and is pointing sharply upward (around the 65 level). This confirms that bullish momentum is accelerating beautifully without being dangerously overbought yet. The digestion phase is over; the new markup phase has begun.
4. The Trade Plan: Entries, Targets, and Risk Management
Entry Strategy: Momentum is exceptionally strong right now near 221.13. Chasing a daily expansion candle always carries a risk of an immediate intraday drawdown as the stock naturally breathes. The highest-probability, lowest-risk entry involves placing limit orders to catch a potential minor structural pullback to perfectly retest the 214.00 to 216.00 breakout zone. Letting that old heavy resistance prove itself as a new support floor offers a phenomenal risk-to-reward ratio.
Take Profit (Targets): We use measured structural targets based on the depth of the recent base. By taking the depth of the Cup (roughly 33 points from the ~182 floor to the 215.79 ceiling) and projecting it upward from the breakout line, our primary structural swing target sits comfortably in the 248.00 to 250.00 zone.
Invalidation (Stop Loss): A trade thesis is only valid if the new market structure holds. A hard stop loss should be placed safely below the handle consolidation and recent swing lows, around the 198.00 to 200.00 level. A definitive daily close completely back below the 200 mark would act as a massive warning sign of a failed structural breakout and a severe bull trap.
5. Time Horizon:
Because this technical setup is built on a 1-Day chart capturing an explosive Cup and Handle completion into a new markup phase, this is a short-to-medium-term swing trade designed to capture the violent momentum thrust. Let the new trend run!
I am taking a LONG bias on Tata Steel Limited (TATASTEEL) on the daily (1D) timeframe.
When analyzing pure market structure, the healthiest and most sustainable trends do not go straight up in a single volatile line; they climb stairs. Look at the beautiful structural development on this chart. The stock established a rock-solid floor at the 164.46 line. From there, it rallied to the 185.36 line, paused to build a base, broke out, and used that 185 zone as a higher launchpad. This is textbook institutional behavior—systematically absorbing supply and stepping the price higher to prevent catastrophic pullbacks.
2. The Educational Setup: The Pressure Cooker Handle
To understand the sheer strength of this current breakout, look at how the price behaved after reaching the ultimate resistance ceiling at the solid black 215.79 line:
The Washout and Retest: After hitting 215.79, the stock suffered a healthy corrective pullback. Notice where it stopped? Exactly at the dashed 182.31 / solid 185.36 zone. It perfectly retested its previous structural stepping stone, confirming that old resistance had officially become indestructible support. This formed a massive "Cup" structure.
The High-Level Squeeze: As the price marched back up to the 215.79 ceiling, it didn't just smash into it and fail. It consolidated tightly directly underneath it, forming a "Handle." Consolidating right below major historical resistance acts like a pressure cooker, gracefully transferring shares from impatient retail traders to strong-handed institutional buyers and storing immense kinetic energy.
3. Current Price Action: The Lid Blows Off
Look at the most recent daily candles on the far right. The high-level pressure cooker has exploded. Buyers have effortlessly shattered the 215.79 macro ceiling with a strong momentum thrust, pushing the price past 220. Furthermore, look at the RSI indicator at the bottom of the chart. The RSI has smoothly broken out of its own consolidation and is pointing sharply upward (around the 65 level). This confirms that bullish momentum is accelerating beautifully without being dangerously overbought yet. The digestion phase is over; the new markup phase has begun.
4. The Trade Plan: Entries, Targets, and Risk Management
Entry Strategy: Momentum is exceptionally strong right now near 221.13. Chasing a daily expansion candle always carries a risk of an immediate intraday drawdown as the stock naturally breathes. The highest-probability, lowest-risk entry involves placing limit orders to catch a potential minor structural pullback to perfectly retest the 214.00 to 216.00 breakout zone. Letting that old heavy resistance prove itself as a new support floor offers a phenomenal risk-to-reward ratio.
Take Profit (Targets): We use measured structural targets based on the depth of the recent base. By taking the depth of the Cup (roughly 33 points from the ~182 floor to the 215.79 ceiling) and projecting it upward from the breakout line, our primary structural swing target sits comfortably in the 248.00 to 250.00 zone.
Invalidation (Stop Loss): A trade thesis is only valid if the new market structure holds. A hard stop loss should be placed safely below the handle consolidation and recent swing lows, around the 198.00 to 200.00 level. A definitive daily close completely back below the 200 mark would act as a massive warning sign of a failed structural breakout and a severe bull trap.
5. Time Horizon:
Because this technical setup is built on a 1-Day chart capturing an explosive Cup and Handle completion into a new markup phase, this is a short-to-medium-term swing trade designed to capture the violent momentum thrust. Let the new trend run!
Trade closed: stop reached
Price crashed after fake breakout.
Disclaimer
The information and publications are not meant to be, and do not constitute, financial, investment, trading, or other types of advice or recommendations supplied or endorsed by TradingView. Read more in the Terms of Use.
Disclaimer
The information and publications are not meant to be, and do not constitute, financial, investment, trading, or other types of advice or recommendations supplied or endorsed by TradingView. Read more in the Terms of Use.