
TCS Monthly | Below 200 EMA — 15-Year Trendline Meets 0.786 Fib
Overview
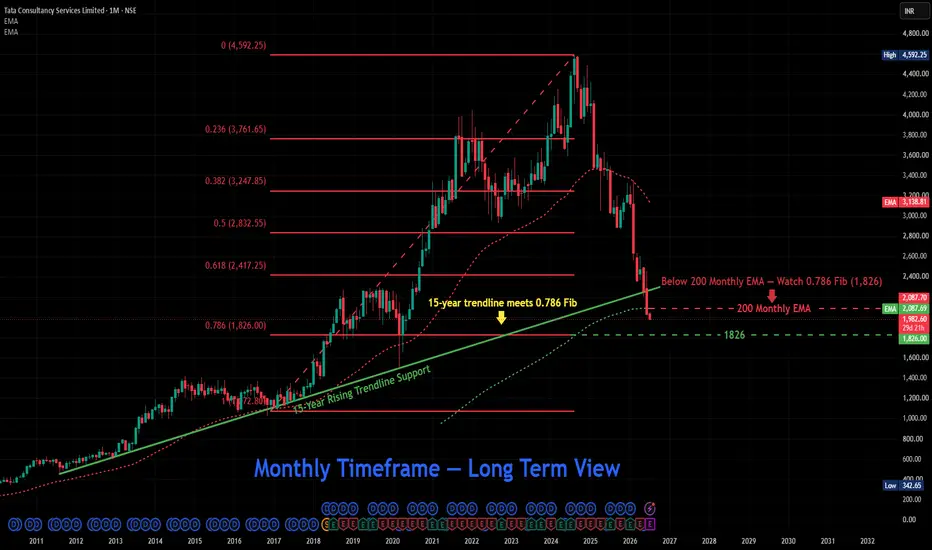
Tata Consultancy Services — India's largest IT company by market cap — is at one of the most significant technical junctions in its entire listed history. On the Monthly timeframe, TCS has broken below its 200 Monthly EMA and is now in a deep Fibonacci retracement, approaching a confluence of two major long-term support structures.
This is a long-term view. The analysis covers price action spanning over 15 years.
The Fibonacci Structure
The Fibonacci retracement is drawn from the all-time high of ₹4,592 (0) to the major base of ₹1,072 (1) — a complete measurement of TCS's entire bull run.
Key levels:
0.236 — ₹3,761 (broken)
0.382 — ₹3,247 (broken)
0.5 — ₹2,832 (broken)
0.618 — ₹2,417 (broken)
0.786 — ₹1,826 (next major support)
Current price at ₹1,982 has already broken through the 0.618 level — a deep retracement level that typically signals either strong long-term buying opportunity or a fundamental structural shift.
The 200 Monthly EMA — A Rare Signal
TCS is currently trading below its 200 Monthly EMA at ₹2,087. This is an extremely rare occurrence for a quality large-cap stock of TCS's caliber. Historically, price trading below the 200 monthly EMA signals a major long-term trend shift and typically attracts significant institutional attention — either for accumulation or further distribution.
The Critical Confluence — 15-Year Trendline + 0.786 Fibonacci
The most important element on this chart is the convergence of two independent structures:
🟢 15-Year Rising Trendline — connecting the lows from 2011 all the way to present. This trendline has held through multiple market cycles — COVID crash, global selloffs, and sector rotations.
🟡 0.786 Fibonacci level at ₹1,826 — the deepest standard Fibonacci retracement level before a full 100% retracement.
Both of these meet at approximately the ₹1,826–1,900 zone — making this the most critical support area on TCS's entire chart history.
Key Levels
🔴 Resistance 1 — 3,342
🔴 Resistance 2 — 3,477
🔴 Resistance 3 — 3,647
🔴 Resistance 4 — 4,310
🟡 200 Monthly EMA — 2,087 (now resistance)
🟢 Current Price — 1,982
🟢 Major Confluence Support — 1,826 (0.786 Fib + 15-Year Trendline)
🔴 Full Retracement Base — 1,072
Two Scenarios
🟢 Scenario A — Confluence Holds
Price reaches the ₹1,826–1,900 confluence zone and finds strong long-term buyers. This would represent one of the best risk-reward buying opportunities in TCS's history — with the 15-year trendline and 0.786 Fib acting as dual support. First recovery target would be reclaiming the 200 Monthly EMA at ₹2,087, then progressively higher resistance levels.
🔴 Scenario B — Confluence Breaks
If price breaks below ₹1,826 on a monthly closing basis, both the 15-year trendline and the 0.786 Fibonacci support fail simultaneously. This would be a historically significant breakdown — signaling a fundamental long-term structural change for TCS. Next reference level would be the full retracement base near ₹1,072.
Important Context
This analysis is on the Monthly timeframe — each candle represents one full month of price action. Setups on this timeframe play out over months to years, not days. This is not a short-term trade setup — it is a long-term structural view for investors and positional traders.
TCS results are due soon — fundamental developments will interact with these technical levels. Always combine technical analysis with fundamental context before making decisions.
Conclusion
TCS is approaching a historic confluence — a 15-year rising trendline meeting the 0.786 Fibonacci retracement at ₹1,826. Whether this level holds or breaks will define TCS's long-term trajectory for years to come.
This is a level worth watching very carefully over the coming months.
For educational purposes only. Not financial advice. Always manage your risk.
Tata Consultancy Services — India's largest IT company by market cap — is at one of the most significant technical junctions in its entire listed history. On the Monthly timeframe, TCS has broken below its 200 Monthly EMA and is now in a deep Fibonacci retracement, approaching a confluence of two major long-term support structures.
This is a long-term view. The analysis covers price action spanning over 15 years.
The Fibonacci Structure
The Fibonacci retracement is drawn from the all-time high of ₹4,592 (0) to the major base of ₹1,072 (1) — a complete measurement of TCS's entire bull run.
Key levels:
0.236 — ₹3,761 (broken)
0.382 — ₹3,247 (broken)
0.5 — ₹2,832 (broken)
0.618 — ₹2,417 (broken)
0.786 — ₹1,826 (next major support)
Current price at ₹1,982 has already broken through the 0.618 level — a deep retracement level that typically signals either strong long-term buying opportunity or a fundamental structural shift.
The 200 Monthly EMA — A Rare Signal
TCS is currently trading below its 200 Monthly EMA at ₹2,087. This is an extremely rare occurrence for a quality large-cap stock of TCS's caliber. Historically, price trading below the 200 monthly EMA signals a major long-term trend shift and typically attracts significant institutional attention — either for accumulation or further distribution.
The Critical Confluence — 15-Year Trendline + 0.786 Fibonacci
The most important element on this chart is the convergence of two independent structures:
🟢 15-Year Rising Trendline — connecting the lows from 2011 all the way to present. This trendline has held through multiple market cycles — COVID crash, global selloffs, and sector rotations.
🟡 0.786 Fibonacci level at ₹1,826 — the deepest standard Fibonacci retracement level before a full 100% retracement.
Both of these meet at approximately the ₹1,826–1,900 zone — making this the most critical support area on TCS's entire chart history.
Key Levels
🔴 Resistance 1 — 3,342
🔴 Resistance 2 — 3,477
🔴 Resistance 3 — 3,647
🔴 Resistance 4 — 4,310
🟡 200 Monthly EMA — 2,087 (now resistance)
🟢 Current Price — 1,982
🟢 Major Confluence Support — 1,826 (0.786 Fib + 15-Year Trendline)
🔴 Full Retracement Base — 1,072
Two Scenarios
🟢 Scenario A — Confluence Holds
Price reaches the ₹1,826–1,900 confluence zone and finds strong long-term buyers. This would represent one of the best risk-reward buying opportunities in TCS's history — with the 15-year trendline and 0.786 Fib acting as dual support. First recovery target would be reclaiming the 200 Monthly EMA at ₹2,087, then progressively higher resistance levels.
🔴 Scenario B — Confluence Breaks
If price breaks below ₹1,826 on a monthly closing basis, both the 15-year trendline and the 0.786 Fibonacci support fail simultaneously. This would be a historically significant breakdown — signaling a fundamental long-term structural change for TCS. Next reference level would be the full retracement base near ₹1,072.
Important Context
This analysis is on the Monthly timeframe — each candle represents one full month of price action. Setups on this timeframe play out over months to years, not days. This is not a short-term trade setup — it is a long-term structural view for investors and positional traders.
TCS results are due soon — fundamental developments will interact with these technical levels. Always combine technical analysis with fundamental context before making decisions.
Conclusion
TCS is approaching a historic confluence — a 15-year rising trendline meeting the 0.786 Fibonacci retracement at ₹1,826. Whether this level holds or breaks will define TCS's long-term trajectory for years to come.
This is a level worth watching very carefully over the coming months.
For educational purposes only. Not financial advice. Always manage your risk.
Note
Update — Confluence Zone Tested, Sharp Reversal Within the Month
Since this idea was published on July 1, TCS extended lower, with the July monthly candle showing a low of 1,976.80 so far — just above the major confluence support of 1,826 (0.786 Fib + 15-Year Trendline). From there, price has recovered sharply, currently trading at 2,200.60 (+8.32% for the month so far), pushing back above the 200 Monthly EMA (2,087/2,089.86).
This is a meaningful development: rather than breaking down through the confluence zone (Scenario B from the original post), price found buyers well above the critical 1,826 level and is currently trading back above the 200 Monthly EMA — the first part of Scenario A's "recovery target" potentially playing out. That said, since this is a Monthly timeframe and July hasn't closed yet, this move needs to hold through month-end to count as a confirmed monthly close above the EMA.
What to Watch Now
200 Monthly EMA (2,087–2,090): currently reclaimed intra-month — needs to hold through month-end for a confirmed monthly close above it
Next Resistance: 0.618 Fib (2,417.25), followed by 0.5 Fib (2,832.55)
Confluence Support Below: 1,826 (0.786 Fib + 15-Year Trendline) remains the key structural level if this move fades before month-end
Important Context
This remains a Monthly timeframe view — even a strong intra-month recovery doesn't confirm a trend change until the candle actually closes. As with the original analysis, this needs to be watched over the coming months, not days, and should be considered alongside TCS's fundamental developments rather than in isolation.
Conclusion
TCS is showing a strong reaction well above its historic confluence zone so far this month, currently trading back above the 200 Monthly EMA. Whether this holds through month-end and builds into a genuine long-term reversal, or fades back down, will become clearer as July's candle closes and over the following months.
For educational purposes only. Not financial advice. Always manage your risk.
Note
Update — Strong Bounce, +18% and Reclaiming the 200 Monthly EMA
Big move here since our last update. TCS is up 18.23% this month, currently trading at 2,401.80 — right back above the 200 Monthly EMA (2,087.7).
What's happened:
Price held the 15-year trendline + 0.786 Fib confluence zone (1,826) exactly like we were watching for
Since then, it's rallied hard, reclaiming the 200 Monthly EMA
Next level ahead is the 0.618 Fib (2,417.25) — price is right at it now
What to watch next:
Can this hold above the 200 EMA through month-end? That's still the key confirmation needed
If it clears 2,417, the 0.5 Fib (2,832.55) is the next level up
The 1,826 zone remains the big support if this move fades
Bottom line: the confluence zone did its job, and this is a strong bounce. Still needs to hold through month-end close to count as a real trend shift, not just a sharp month.
For educational purposes only. Not financial advice. Always manage your risk.
Trade closed: target reached
Target achieved (₹2,087 EMA reclaimed, high of ₹2,495)
📈 HK Trading Community | Market Structure & Indicator Updates
Telegram: t.me/trendstrike1000
Website: quantumedgepro.netlify.app/
Real traders are built through learning,not tip hunting.So Start Learning How the Market Really Works
Telegram: t.me/trendstrike1000
Website: quantumedgepro.netlify.app/
Real traders are built through learning,not tip hunting.So Start Learning How the Market Really Works
Disclaimer
The information and publications are not meant to be, and do not constitute, financial, investment, trading, or other types of advice or recommendations supplied or endorsed by TradingView. Read more in the Terms of Use.
📈 HK Trading Community | Market Structure & Indicator Updates
Telegram: t.me/trendstrike1000
Website: quantumedgepro.netlify.app/
Real traders are built through learning,not tip hunting.So Start Learning How the Market Really Works
Telegram: t.me/trendstrike1000
Website: quantumedgepro.netlify.app/
Real traders are built through learning,not tip hunting.So Start Learning How the Market Really Works
Disclaimer
The information and publications are not meant to be, and do not constitute, financial, investment, trading, or other types of advice or recommendations supplied or endorsed by TradingView. Read more in the Terms of Use.