
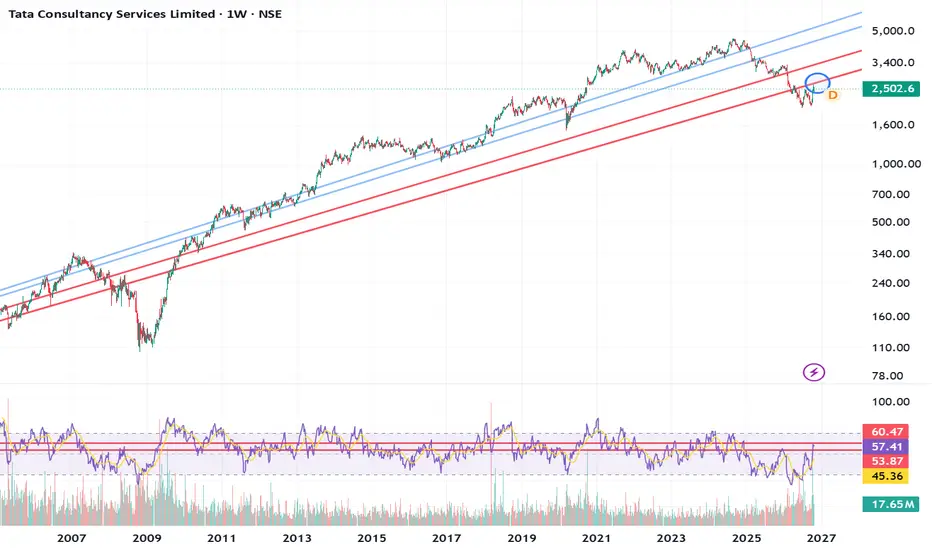
Long term chart. TCS expected to face resistance in 2750 to 2800 zone in coming weeks. The blue circle marks the zone. Next resistance will come from the upper red trendline.

Disclaimer
The information and publications are not meant to be, and do not constitute, financial, investment, trading, or other types of advice or recommendations supplied or endorsed by TradingView. Read more in the Terms of Use.
Disclaimer
The information and publications are not meant to be, and do not constitute, financial, investment, trading, or other types of advice or recommendations supplied or endorsed by TradingView. Read more in the Terms of Use.